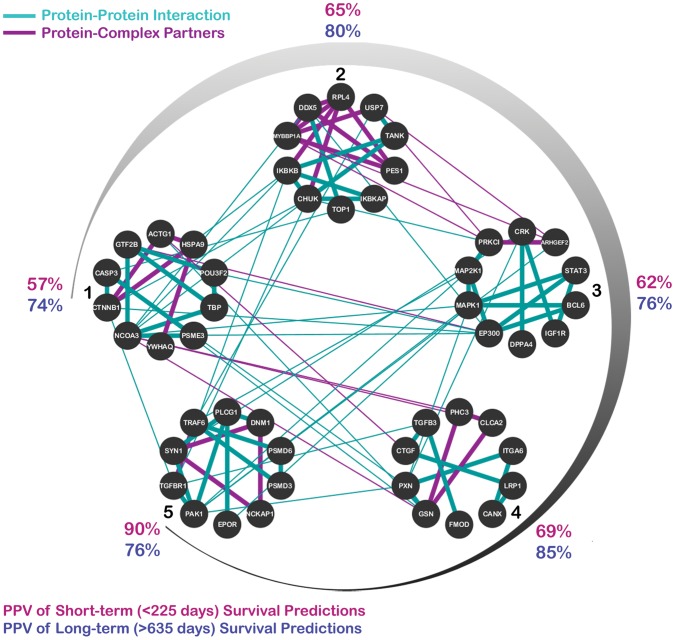
Figure 2. The top five CRANE subnetworks representing a signature of survival in glioblastoma.
Gene names are indicated within the nodes; edges represent either protein-protein interactions (turquoise), or proteins found together as partners within a complex (violet). Subnetworks are added into the classifier in clockwise fashion (from 1 to 5); after the addition of each subnetwork, an updated positive predictive value (PPV) is calculated, as shown along the periphery for prediction of both short-term (pink) and long-term (purple) survival.

