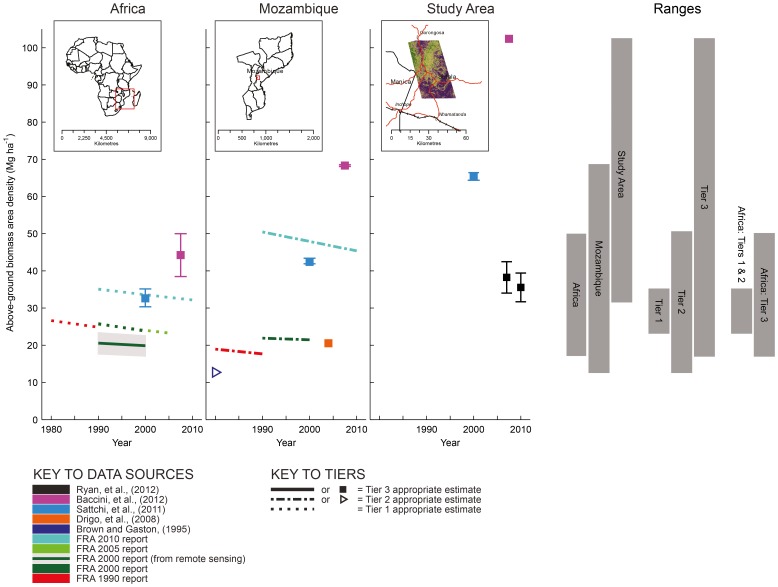
Figure 1. Estimated above-ground biomass area density (AGBD) at the scale of Africa, Mozambique and the study area.
Colours are used to denote the primary source of information. Depending on temporal extent, the style of line or marker is used indicate if an estimate is Tier 1, 2 or 3 appropriate. Where available, uncertainties have been scaled to 95% confidence levels and are indicated with error bars or shading (in the case of the FRA 2000 report). To the right of the plots, bars are used to indicate the ranges of three groupings (i.e. different scales, different Tiers, or Tiers 1 and 2 versus Tier 3 for Africa).

