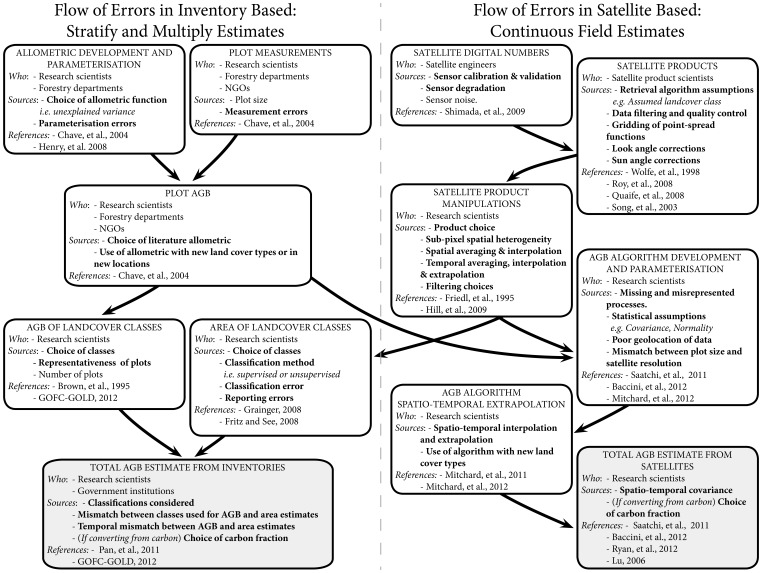
Figure 2. Flow of errors in inventory and satellite based AGB estimates.
Boxes are used to highlight particular steps that contribute to the overall uncertainty. The groups of users that typically carry out each step, and specific sources of error are indicated in the text within each box. Where an error is likely to be systematic, the descriptive text is shown in bold. Arrows indicate the flow of information and therefore errors. This diagram is for illustrative purposes and should not be seen as an attempt to set out a comprehensive list of all errors, for all estimates of AGB. The references included are: [17], [19], [23], [28], [32], [33], [34], [35], [36], [37], [38], [39], [40], [41], [42].

