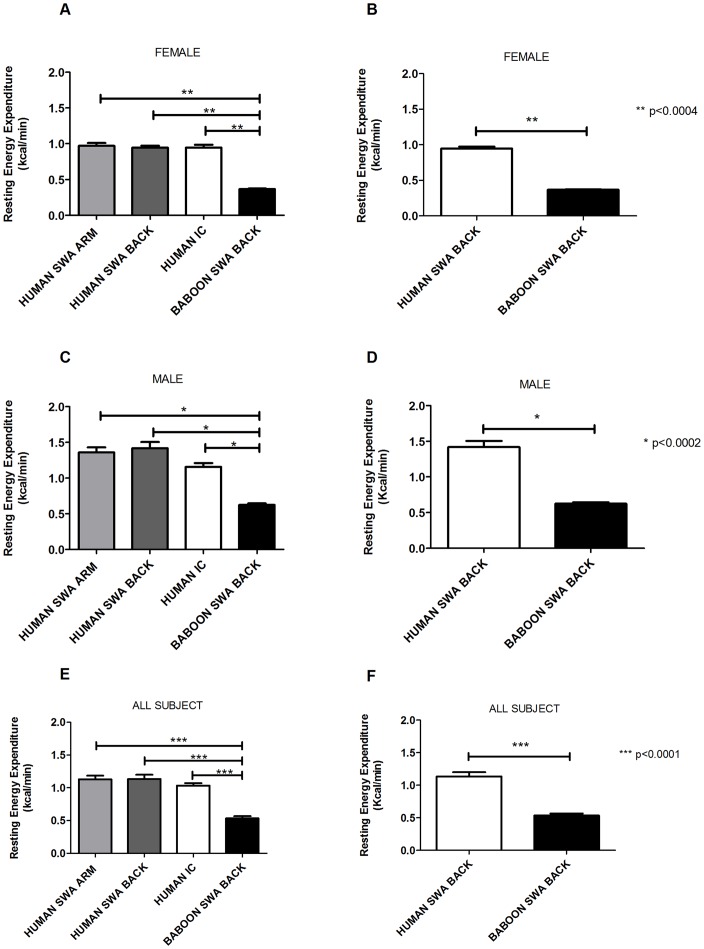
Figure 4. Comparison between humans and baboons.
Comparison of EE at resting between humans and baboons, in the female groups (A) in all the locations placed and (B) only on the back , in the male group (C) in all the locations placed and (D) only on the back ; in all the subjects (E) in all the locations placed and (F) only on the back.

