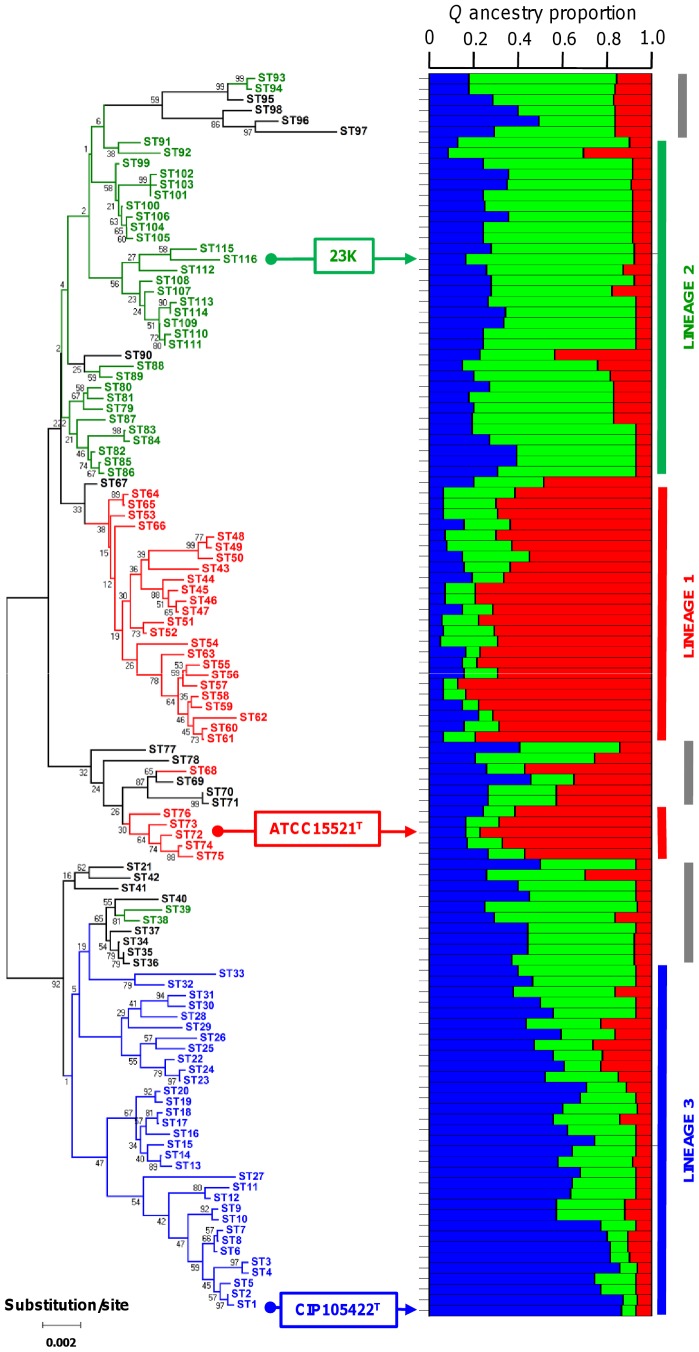
Figure 1. Ancestry and phylogenetic tree of 116 L. sakei STs.
(right) Proportion of genetic material derived from each of three subpopulations for each ST as inferred by Structure (assuming K = 3 populations and applying the linkage model). Ancestral subpopulations are colored in red (lineage 1), green (lineage 2), and blue (lineage 3), respectively. Each bar (stacked vertically) represents one of 116 STs, ordered on the y axis by their positions in the NJ tree. The vertical thick gray lines show clusters of STs with mixed population origins. (left) Phylogenetic NJ tree obtained from the concatenated sequences of the 116 STs. Bootstrap values are indicated for all branches. STs are colored according to their affiliation to one of the three lineages; admixed STs are in black. The positions of the two L. sakei subspecies type strains and of strain 23K are indicated by arrows.

