
Figure 3. Lineage-dependent rarefaction curves.
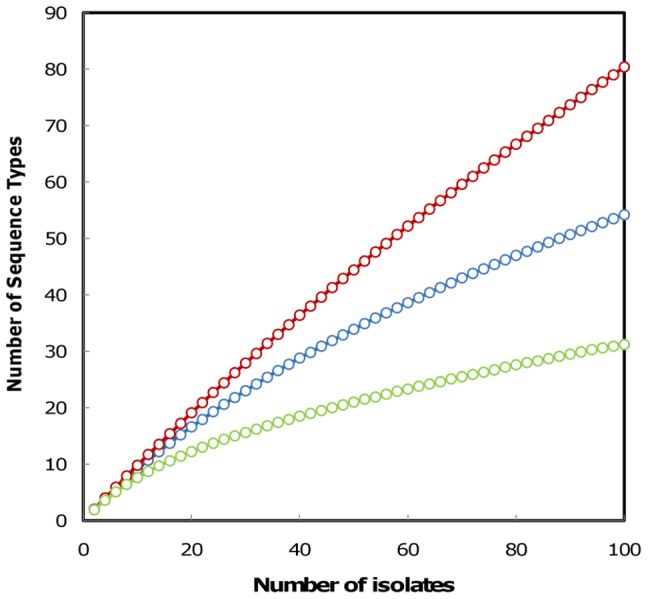
Estimated ST richness obtained as a function of the number of strains sampled, in red (lineage 1), green (lineage 2), and blue (lineage 3).
Official websites use .gov
A
.gov website belongs to an official
government organization in the United States.
Secure .gov websites use HTTPS
A lock (
) or https:// means you've safely
connected to the .gov website. Share sensitive
information only on official, secure websites.
Estimated ST richness obtained as a function of the number of strains sampled, in red (lineage 1), green (lineage 2), and blue (lineage 3).