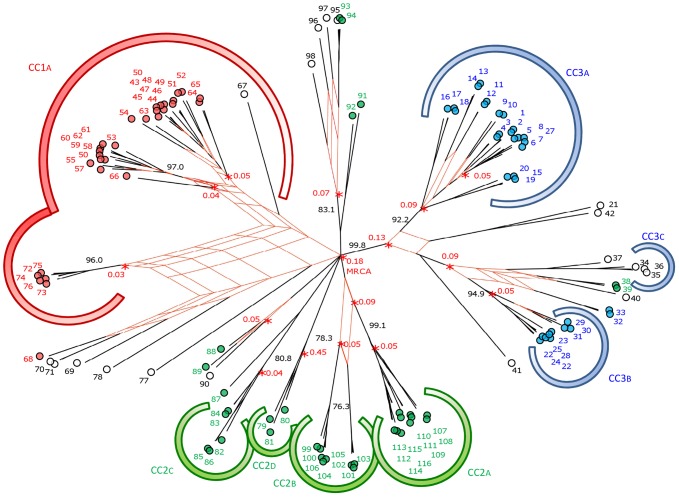
Figure 4. Influence of recombination on the L. sakei genealogy.
SplitsTree consensus network based on 10,000 phylograms produced by the ClonalFrame analysis of the concatenated sequences of the 116 STs, with correction for recombination. The network of phylogenetic ambiguities was drawn for all branches having more than 20% uncertainty. Each circle represents a unique ST (labeled with ST designation) and is colored according to its lineage affiliation as inferred by Structure: red (lineage 1), green (lineage 2), and blue (lineage 3). STs with admixture are represented by open circles. Major CCs are distinguished by large colored arcs. Posterior probability values for main branches are depicted in black to the side of the branch. Time in coalescent units (based on ClonalFrame 50% majority-rule consensus tree; Figure S2) is given (in red) for the main nodes of the tree.

