
Figure 5. Lineage-dependent genome size of L. sakei strains.
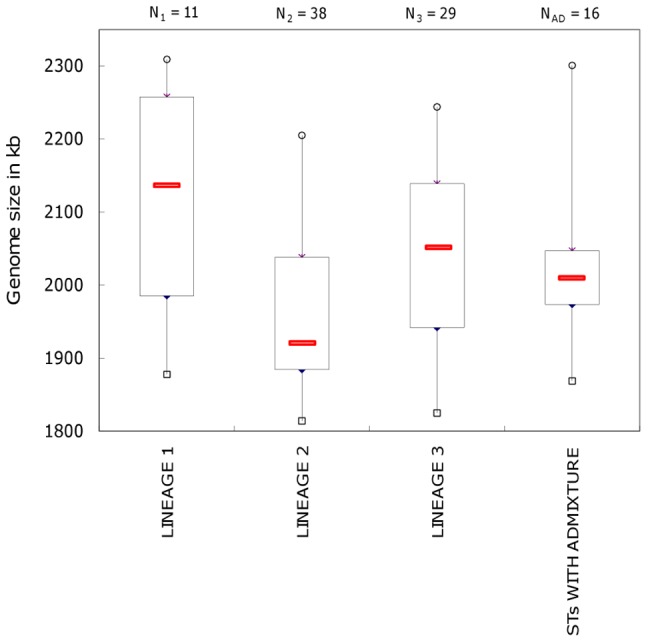
Box plot showing the distribution of the estimated genome size of isolates within each lineage. The median value is indicated by a red rectangle; top and bottom of boxes indicate first and third quartiles, respectively. Minimum and maximum values are shown with small rectangles and circles, respectively. The number of strains per lineage for which the genome size has been determined via pulse-field gel electrophoresis and I-CeuI digestion is indicated above each plot (N1, N2, etc.).