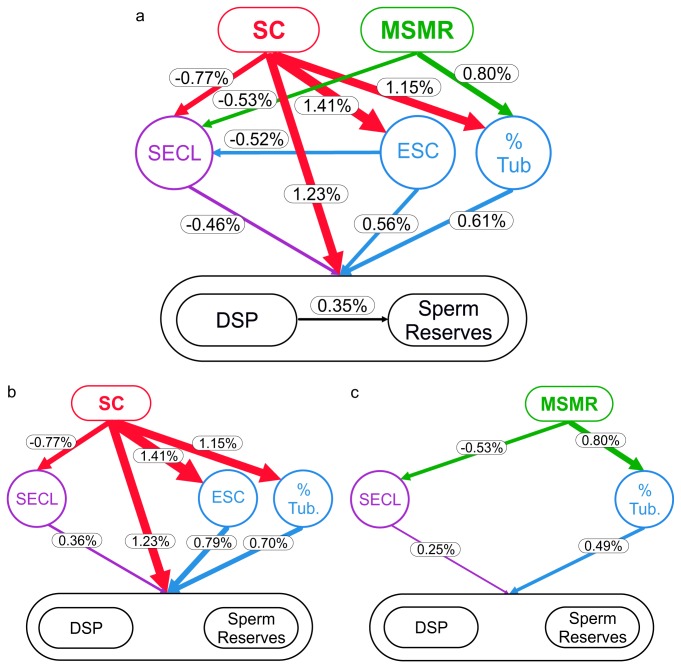
Figure 1. Schematic representation of the relationships between sperm competition, mass-specific metabolic rate, testicular architecture, kinetics of spermatogenesis, sperm production and numbers in sperm reserves in eutherian mammals.
a, Static 1% variations: numbers next to arrows are the relative variation in the dependent variable caused by a variation of 1% of the sample range in the independent variable. For example, there is a -0.77% decrease in SECL when we increase SC by 1%. b, c, Dynamic variations: numbers next to arrows between level 1 and level 2 variables are the relative variation in the dependent variable caused by a variation of 1% of the sample range in the independent variable (thus these values are the same as in panel a); numbers next to arrows between level 2 and level 3 variables are the relative variation in the dependent variable (level 3) caused by the change in the independent variable (level 2) due to a 1% increment in level 1. All relative variations are presented as percentages of the sample range. Relative variation percentages were calculated using the slopes and intercepts estimated by PGLS models. Arrow widths are proportional to indicated magnitudes. Abbreviations: SC: sperm competition (relative testes size); MSMR: mass-specific metabolic rate; SECL: seminiferous epithelium cycle length; ESC: efficiency of Sertoli cells; % Tub: percentage of the testicular tissue occupied by seminiferous tubules; DSP: daily sperm production; Sperm Reserves: number of spermatozoa in the caudae epididymides.

