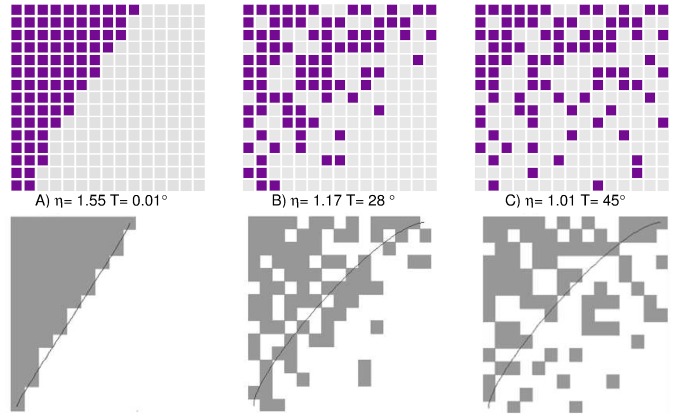
Figure 1. Measures of nestedness in networks.
The figure shows three different connectivity matrices with different levels of nestedness as measured by (i) our new nestedness index [Eq. (6)] and (ii) the standard nestedness “temperature’ calculator”. As can be readily seen, the most packed matrix corresponds to a very low temperature and to a high nestedness index ( ) and, reciprocally, the least packed one exhibits a high temperature and an index close to its expected value for a random network (
 ).
).

