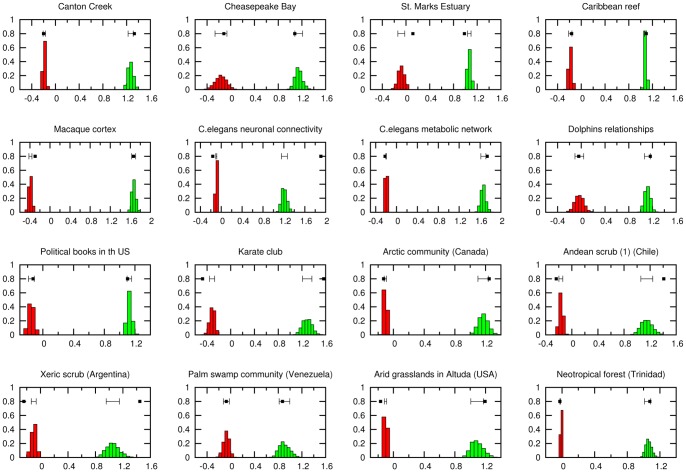
Figure 3. Correlation coefficient and nestedness in degree-preserving randomiaztions.
Probability distribution of Pearson’s coefficient  and of the nestedness coefficient,
  , as measured in degree-preserving randomizations of a subset of
  (out of a total of
  ) real empirical networks (as described and referenced in Appendix S5). The actual empirical values in the real network are marked with a black box and compared (also in black) with a segment centered at the mean value of the random ensemble (configuration model) with width equal to one standard deviation. In most cases but not all, the empirical values lie in or near the corresponding interval, suggesting that typically empirical networks are not significantly more assortative/nested than randomly expected.

