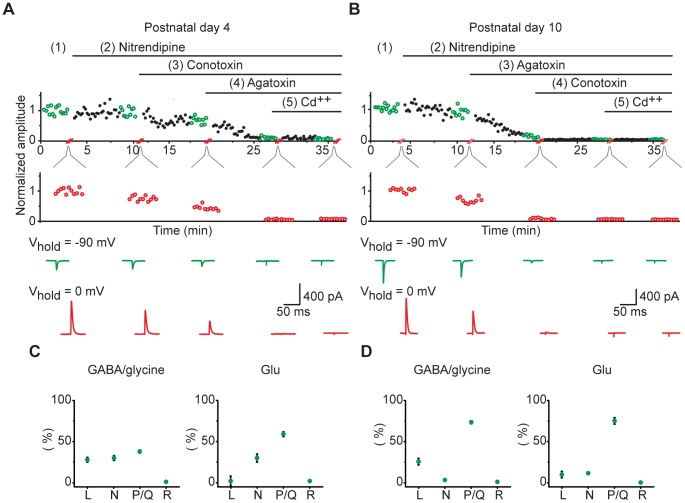
Figure 3. Proportional contribution of VGCC subtypes to GABA/glycine and glutamate transmission.
(A–B) Representative examples showing how VGCC contribution to GABA/gly and glutamate neurotransmission was determined in (A) a P4 slice, and (B) a P10 slice. Average GABA/gly (red) and glutamate (green) current traces are shown below, and correspond to the colored points above for each component. (C–D) Proportional contribution of each VGCC to GABA/gly and glutamate components for the P4 slice shown in A (C), and for the P10 slice shown in B (D).

