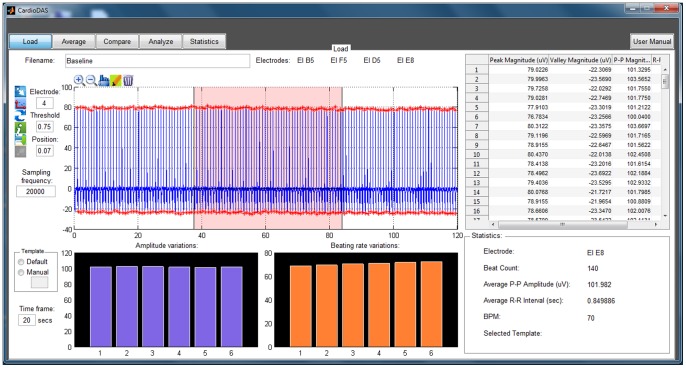
Figure 2. Screenshot of the graphical user interface for CardioMDA.
The screenshot presents the Load panel of the CardioMDA software with its interactive interface options and basic signal information. Once the template has been selected, the user then moves to the Average panel to set and execute the correlation analysis. Compare, Analyze and Statistics panel are used to measure the field potential duration and compare it with other drug concentrations.

