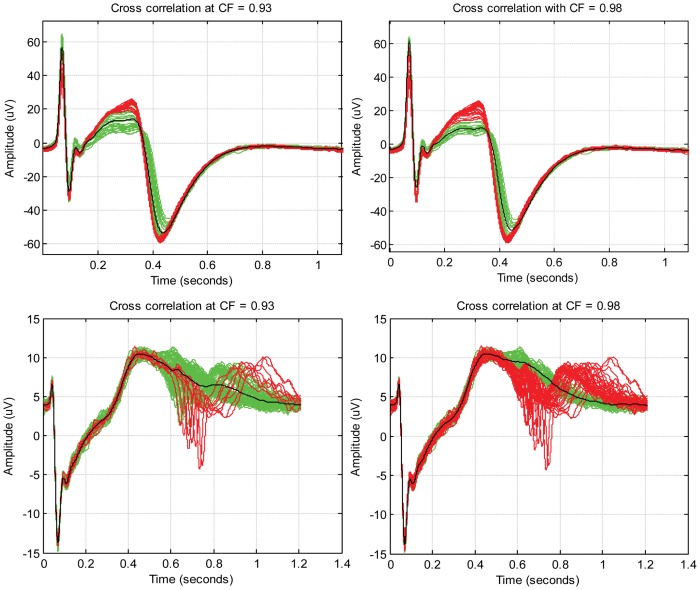
Figure 4. Comparison of correlation analysis results with different values of correlation factor.
An illustration of the correlation analysis procedure for morphology changing (top row) and arrhythmogenic signals showing premature activation (bottom row) for different correlation factors is shown. The field potential complexes in green have a correlation coefficient greater than correlation factor and are identified as true field potential complexes (accepted for averaging) whereas those in red are identified as true negatives (rejected for averaging). The black line presents the morphology of averaged signal. In both cases, it can be seen that for lower value of correlation factor (0.93), a number of false positives occur, causing a significant change in the morphology of the averaged waveform. From the bottom row, it can be seen that a higher correlation factor (0.98) is more accurate in identifying the true field potential complexes.

