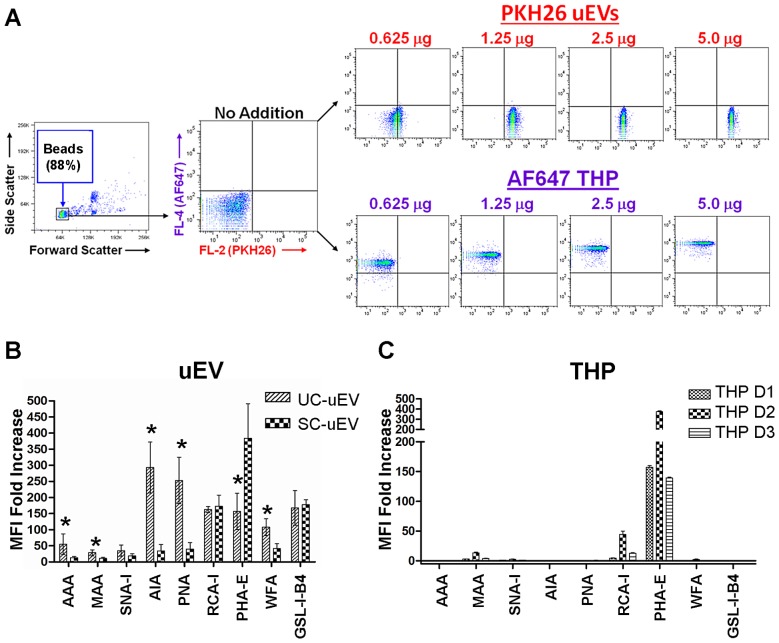
Figure 3. Quantitative analysis of lectin binding to bead-bound uEVs and THP by flow cytometry.
(A) Verification of PKH26 labeled uEVs and AlexaFluor® 647 labeled THP conjugation to latex beads. Relative mean fold intensity of staining for 9 lectins with (B) 5 µg unlabeled UC- and SC-uEVs and (C) 20 µg unlabeled THP from 3 healthy donors (D1, D2 and D3) conjugated to latex beads. Data is representative of 3 biological replicates. Error bars represent ±1 standard deviation. Significance (* = p<0.05 for UC-uEV vs. SC-uEV) was determined by paired, two-tailed Student’s t-tests.

