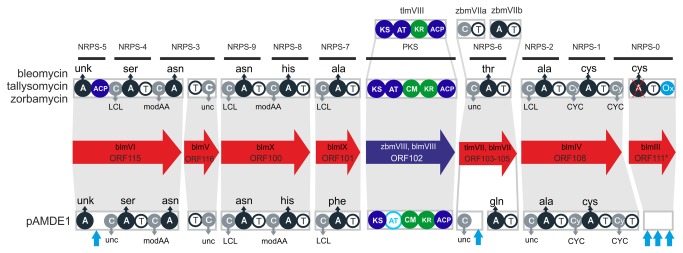
Figure 4. Comparison of the protein domains of pAMDE1 to bleomycin related clusters.

NRPS genes are represented in red and the PKS gene in blue. Within the arrows the names of the ORF in pAMDE1 and the homologs in the bleomycin or the other clusters are indicated. The protein domains are shown inside the boxes. In addition, functional classification is shown for condensation domains (C) and the substrate amino acid for each adenylation domain (A). The modules (NRPS-0 to NRPS-9) described for the bleomycin compounds are represented by the black lines above the domains. Light blue arrows indicate putative missing domains in pAMDE1 in comparison to bleomycin. AT and KR domains are also shown in light blue. Blm genes: bleomycin, zbm genes: zorbamycin, tlm genes: tallyzomycin. LCL: catalyzes peptide bond formation between 2 L-amino acids, CYC: heterocyclization domain, modAA: modify the incorporated amino acids, unc: unclassified. A non-functional A-domain is marked with a red-cross.
