
Figure 5. Simulation results (blue) and experimental data (red/black) of CD4+ T cells exhibit similar distributions for euchromatin and heterochromatin on chromosome 1.

The red dots show both H3K9me2 and H3K9me3 marks together, i.e. plotting their scores. The black dots exhibit all scores for the marks H3K4me2, H3K4me3, H3K18ac and H3K23ac. For each histone we depict its occupation frequency averaged over the last 100,000(green dots) merely function as initiators of the process whereas propagation acts as the main competitor in the system. The blue dots show the histone mark distribution. The black and red dots correspond to the same experimental data from Figure 1, this time normalized for better visualization. Model parameters were 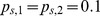 ,
,  ,
,  .
.