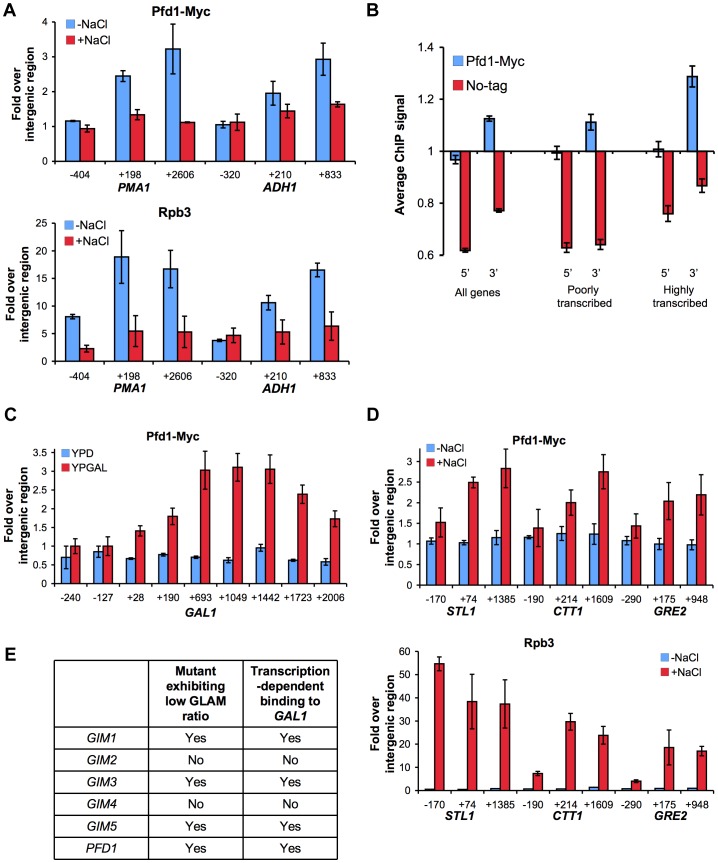
Figure 4. Prefoldin binds the transcribed region of active genes.
A. Pfd1 binds the transcribed regions of ADH1 and PMA1 in a transcription dependent manner. Binding of Pfd1-Myc and Rpb3 to the indicated regions of these two genes was analyzed in cells exponentially growing in YPD medium, before and 10 min after adding 0.4 M NaCl. Pfd1-Myc and Rpb3 occupancy was analyzed by ChIP, as described in the Materials and methods section. Values correspond to the mean and the standard deviation of three biological replicates. B. Pfd1-Myc preferentially binds the 3′ ends of transcribed yeast genes. Pfd1-Myc occupancy across the genome was analyzed by ChIP on chip using Affymetrix tiling arrays, as described in Materials and methods. Average signal of 5′ and 3′ regions (300 bp long) were calculated for all protein-coding genes, and for the 10% showing the highest and the lowest Rpb3 occupancy, according to parallel Anti-Rpb3 ChIP on chip analysis. Mean values and standard error are shown for isogenic Pfd1-Myc and no-tag strains. The linear scale was optimized to visualize the difference with no-tag controls. Significance of this difference, according to the Mann-Whitney test, is commented in the main text. C. Pfd1 binds the transcribed region of GAL1 under galactose-dependent activation conditions. Pfd1-Myc cells exponentially growing in glucose- (YPD) or in galactose-containing medium (YPGAL) were analyzed by ChIP, as described in the Materials and methods section. Values correspond to the mean and the standard deviation of three biological replicates. D. Pfd1 binds the transcribed region of STL1, CTT1 and GRE2 in response to osmotic stress. Binding of Pfd1 and Rpb3 to the indicated regions of these two genes were analyzed in cells exponentially growing in YPD medium, before and 10 min after adding NaCl up to 0.4 M. Pfd1-Myc and Rpb3 occupancy was analyzed by ChIP, as described in the Materials and methods section. Values correspond to the mean and the standard deviation of three biological replicates. E. Correlation between the GLAM phenotype of the prefoldin mutants and the binding of the corresponding proteins to GAL1 in a transcription-dependent manner, according to the data shown in Figures 2B, 4C and S4B–C.

