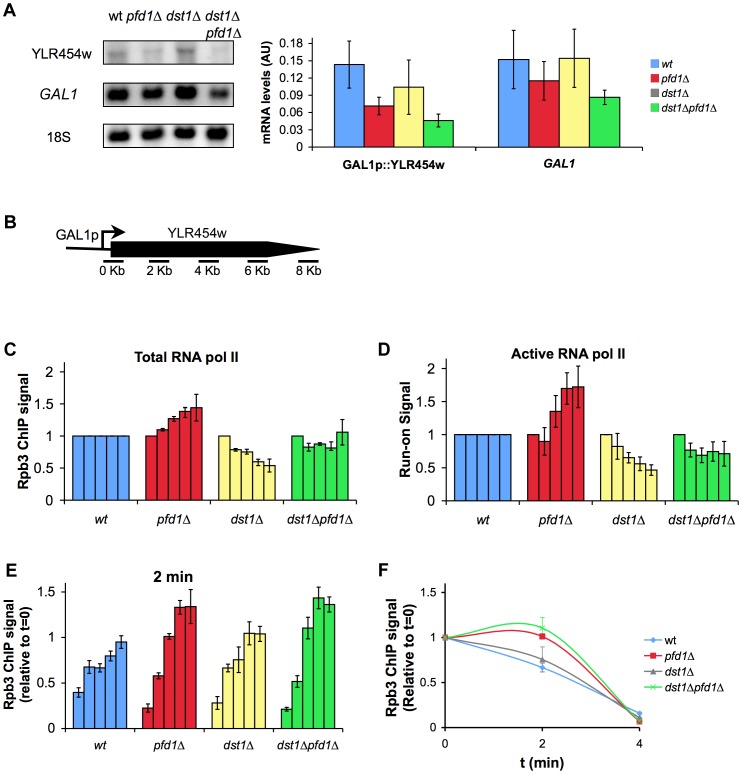
Figure 7. The absence of Pfd1 alters RNA polymerase II elongation across GAL1::YLR454w.
A. mRNA levels of GAL1p-YLR454w are more intensively affected than those of GAL1 in pfd1Δ. GAL1p-YLR454w and GAL1 mRNA levels were measured by Northern in cells growing exponentially in galactose, as described in the Materials and methods section. A significant blot and the quantification of three biological replicas are shown. B. Distribution of the amplicons and probes utilized to measure RNA polymerase II occupancy across GAL1p-YLR454w. C. The profile of total RNA polymerase II along GAL1p-YLR454w is biased towards the 3′ end in pfd1Δ. Occupancy of RNA polymerase II was measured by anti-Rpb3 ChIP in the indicated isogenic strains. Each bar represents one of the amplicons, from 5′ (left) to 3′ (right), described in B. Values were normalized to the 5′ amplicon and to the wild type. The mean and the standard deviation of three biological replicates are shown. Non-normalized data are shown in Figure S6B. D. The profile of active RNA polymerase II along GAL1p-YLR454w is biased towards the 3′ end in pfd1Δ. Distribution of transcriptionally active RNA polymerase II along the GAL1p-YLR454w transcription unit was measured by transcriptional run-on. Cells of the indicated isogenic strains, exponentially growing in YPGAL, were tested for the presence of transcriptionally active RNA polymerases by transcriptional run-on, as it is described in the Materials and methods section. Each bar represents one of the amplicons, from 5′ (left) to 3′ (right), described in B. Values were normalized to the first probe and to the wild type. The mean and the standard deviation of three biological replicates are shown. Non-normalized data are shown in Figure S6C. E. The elongation rate of RNA polymerase II in GAL1p-YLR454w is affected by the absence of Pfd1. RNA polymerase II distribution is shown, 2 min after adding 2% glucose to cells of the indicated isogenic strains that were exponentially growing in galactose medium. Each bar represents one of the amplicons, from 5′ (left) to 3′ (right), described in B. RNA polymerase II levels were measured by anti-Rpb3 ChIP. Values were normalized to time 0 and correspond to the mean and the standard deviation of three biological replicates. F. Relative levels of RNA polymerase II occupancy of the 4 kb region of GAL1p-YLR454w during the last wave of transcription, in the indicated isogenic strains. The plot represents the time course of the normalized values of RNA polymerase II occupancy, measured by anti-Rpb3 ChIP, upon the addition of glucose to cells growing in galactose medium.

