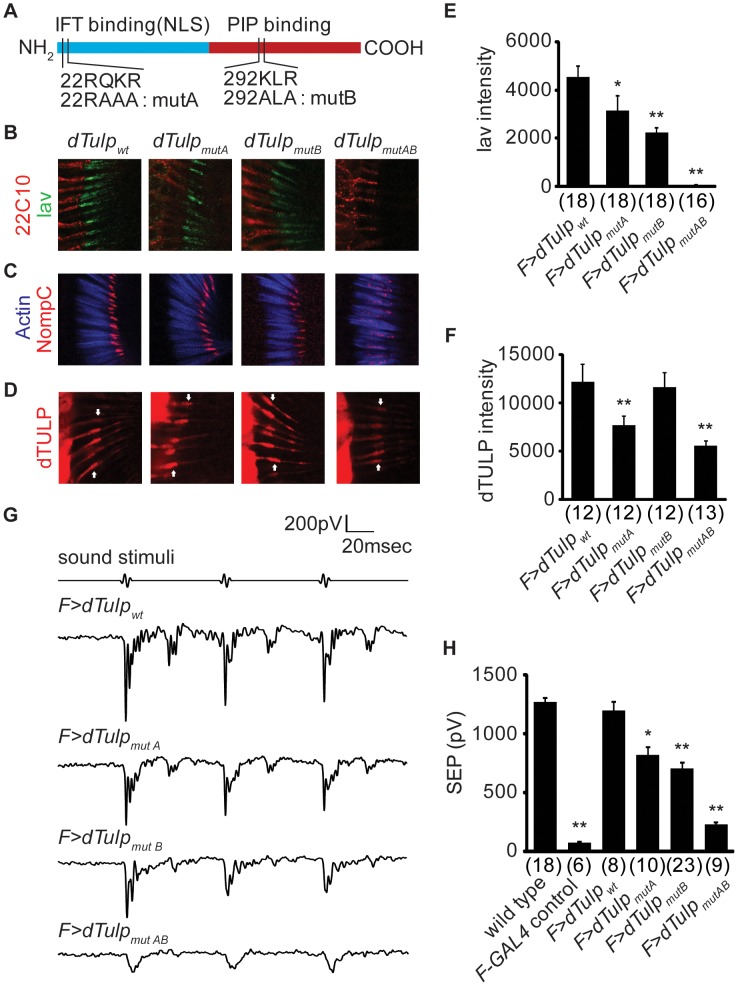
Figure 5. Functional domain mapping of dTULP for ciliary localization of Iav and NompC.
(A) Schematic diagram showing different domains of dTULP as well as dTULP mutant forms (mutA, mutB, and mutAB). Location and identity of each mutation are marked. IFT, intraflagellar transport; NLS, nuclear localization signal; PIP, phosphoinositide. (B–D) Confocal imaging of the second antennal segment in the dTulp knockout flies expressing dTULP wild-type (dTULPwt), dTULPmutA, dTULPmutB, and dTULPmutAB. (B) Confocal imaging of Iav-GFP counterstained with 22C10 which stains neuronal cells except for the cilia located in the outer segment. (C) Immunostaining of NompC counterstained with phalloidin that specifically stains actin-rich scolopales. (D) Immunostaining of dTULP. Arrows indicate the junction between inner and outer segment. (E–F) Quantification of Iav-GFP and dTULP expression levels in the proximal cilia. The number of images analyzed is shown in parentheses. (E) Quantification of Iav-GFP expression level in the proximal cilia. *p<0.05 and **p<0.01 compared to dTULPwt-expressing dTulp mutant. (F) Quantification of dTULP expression level in the proximal cilia. **p<0.01 compared to dTULPwt-expressing dTulp mutant. (G) Representative traces of sound-evoked potentials recorded from the antennal nerve of dTULPwt, dTULPmutA, dTULPmutB, and dTULPmutAB-expressing dTulp1 flies. (H) Quantification of sound-evoked potentials of indicated genotypes. Genotypes of animal are dTulp1/CyO, dTulp1,F-GAL4/dTulp1, dTulp1,F-GAL4/dTulp1;UAS-dTulpwt/+, dTulp1,F-GAL4/dTulp1;UAS-dTulpmutA/+, dTulp1,F-GAL4/dTulp1;UAS-dTulpmutB/+, and dTulp1,F-GAL4/dTulp1;UAS-dTulpmutAB/+. *p<0.05 and **p<0.01 compared to dTulp1/CyO. The number of flies used for quantification of each genotype is indicated in parentheses. All p values were calculated using ANOVA with post-hoc Tukey assay. All error bars represent SEM.

