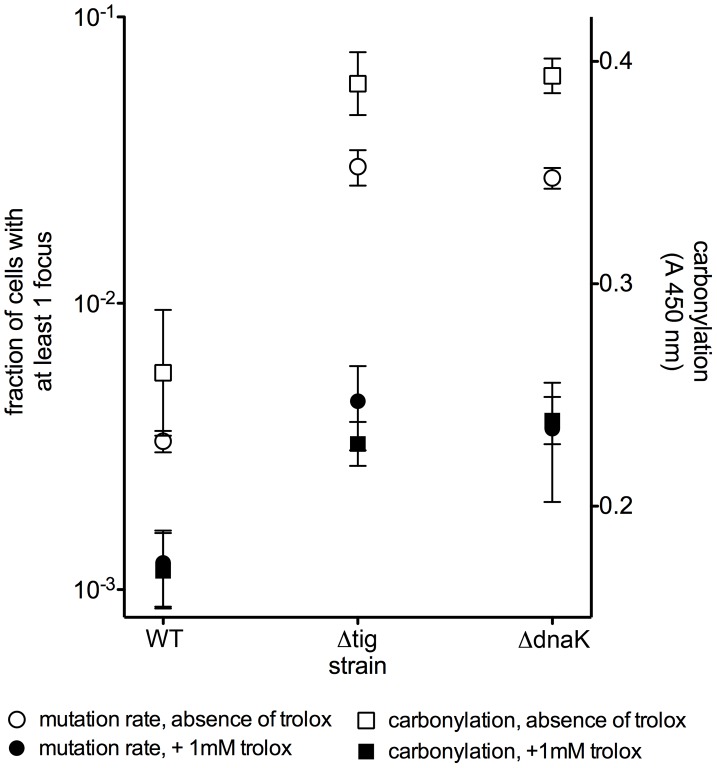
Figure 3. Trolox reduces the amount of protein carbonylation and the mutation rates.
Parallel decrease in mutation rate (white and black circle) (fraction of cells with a MutL-CFP focus) and in constitutive protein carbonylation (white and black square) in the presence of 1 mM trolox (black symbols) relative to no trolox controls (white symbols). The results are given as mean of 3 measurements, each in triplicate. Error bars represent the standard deviation.

