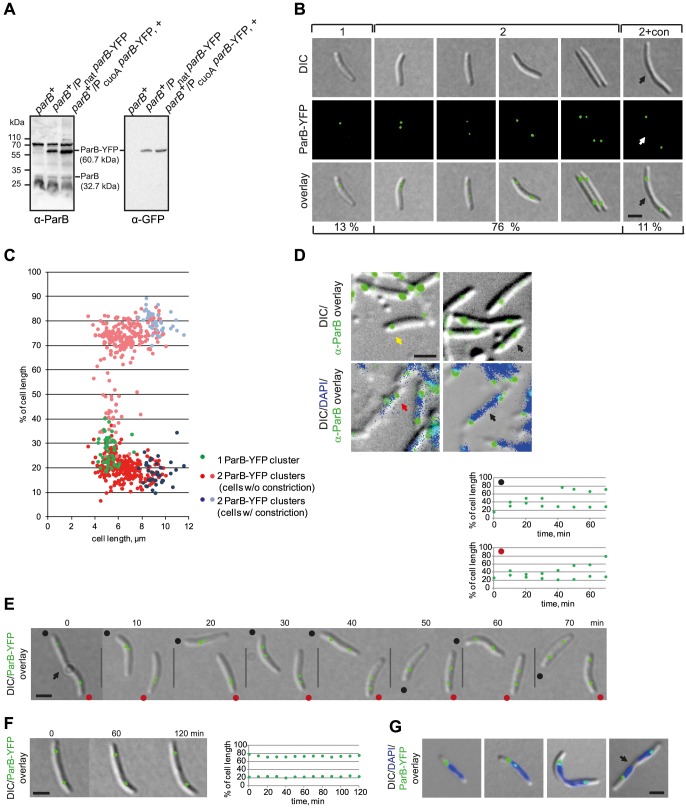
Figure 2. ParB-YFP localizes dynamically and in subpolar clusters.
(A) Immunoblot analysis of ParB and ParB-YFP accumulation in cells of the indicated genotypes. Equal amounts of protein were loaded per lane and the blots were probed with α-ParB and α-GFP antibodies as indicated. ParB and ParB-YFP with their calculated molecular masses as well as positions of molecular markers are indicated. + indicates that the corresponding strain was grown in the presence of 150 µm CuSO4. (B) ParB-YFP forms either one or two clusters. Left panels show a representative short cell with one ParB-YFP cluster (1). The four panels in the middle show cells with two ParB-YFP clusters at different positions (2). The right panel shows a representative cell with a constriction and two ParB-YFP clusters (2+con). The constriction is indicated by an arrow. Scale bar, 2 µm. Numbers below indicate the percentages of cells with the indicated localization pattern (n = 335). (C) Quantification of ParB-YFP localization pattern. Diagram indicates cluster localization as % of cell length and as a function of cell length (n = 335). The old pole is at 0%. (D) Native ParB forms either one or two clusters. Immunofluorescence microscopy using affinity purified α-ParB antibodies (top and bottom rows) together with DAPI staining (lower row). The yellow arrow indicates a cell with a single cluster, black arrows indicate cells with two completely segregated clusters, the red arrow indicates a cell with two clusters, one of which is in an intermediate position. Scale bar, 2 µm. (E) Time-lapse images of ParB-YFP localization. The position of a constriction is indicated by the arrow. Because the recorded cells are moving, the old poles are indicated with a black and red dot. Diagrams above depict the positions of the ParB-YFP cluster in the two newborn cells (red and black dot) as % of cell length over time. The old pole is at 0%. Scale bar, 2 µm. (F) Time-lapse images of stationary ParB-YFP localization. The diagram on the right depicts the position of the ParB-YFP foci as % of cell length over time. Scale bar, 2 µm. (G) ParB-YFP localizes at the “edges” of nucleoids. The images show cells with one or two ParB-YFP cluster. The position of a constriction is indicated by an arrow. Scale bar, 2 µm.

