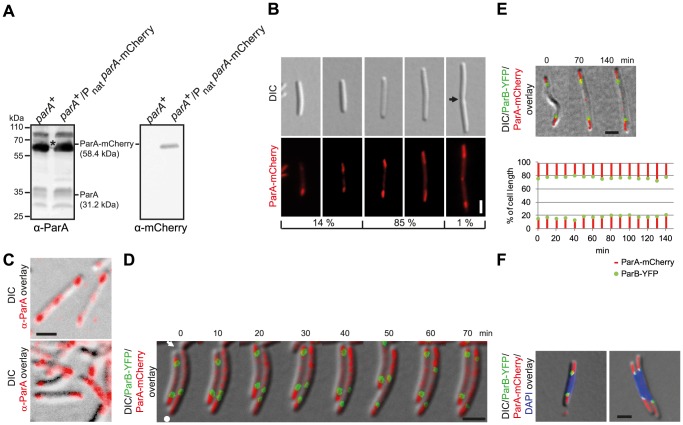
Figure 3. ParA-mCherry localizes dynamically and in subpolar patches.
(A) Immunoblot analysis of ParA and ParA-mCherry accumulation in cells of the indicated genotypes. Equal amounts of protein were loaded per lane and the blots were probed with α-ParA and α-mCherry antibodies as indicated. ParA and ParA-mCherry with their calculated molecular masses are indicated. Positions of molecular markers are indicated. * Note that the band corresponding to ParA-mCherry is partially covered by a non-specific protein detected by α-ParA. (B) ParA-mCherry forms patches in the subpolar regions. Left panels, short cells with ParA-mcherry patches of unequal length and/or intensities. Next two panels, longer cells with ParA-mCherry patches of more equal length and intensities. Last panel, cell with a constriction, subpolar ParA-patches and ParA-mCherry at midcell. The position of a constriction is indicated by an arrow. Scale bar, 2 µm. The numbers below indicate the percentages of cells found with the indicated localization pattern (n = 100). (C) Native ParA forms patches in the subpolar regions. Immunofluorescence microscopy using affinity purified α-ParA antibodies. Scale bar, 2 µm. (D) Time-lapse images of ParB-YFP and ParA-mCherry localization. Cells were grown in the presence of 150 µM CuSO4. A constriction is indicated by the arrow. The old pole is indicated by the white dot. Scale bar, 2 µm. (E) Time-lapse movie of ParB-YFP and ParA-mCherry localization after completion of segregation. Cells were grown in the presence of 150 µM CuSO4. The diagram below depicts the position of the ParB-YFP clusters (green) and the subpolar ParA-mCherry patches (red) as % of cell length over time. Scale bar, 2 µm. (F) ParA-mCherry and ParB-YFP localize at the “edges” of a chromosome. Cells were grown in the presence of 150 µM copper. Scale bar, 2 µm.

