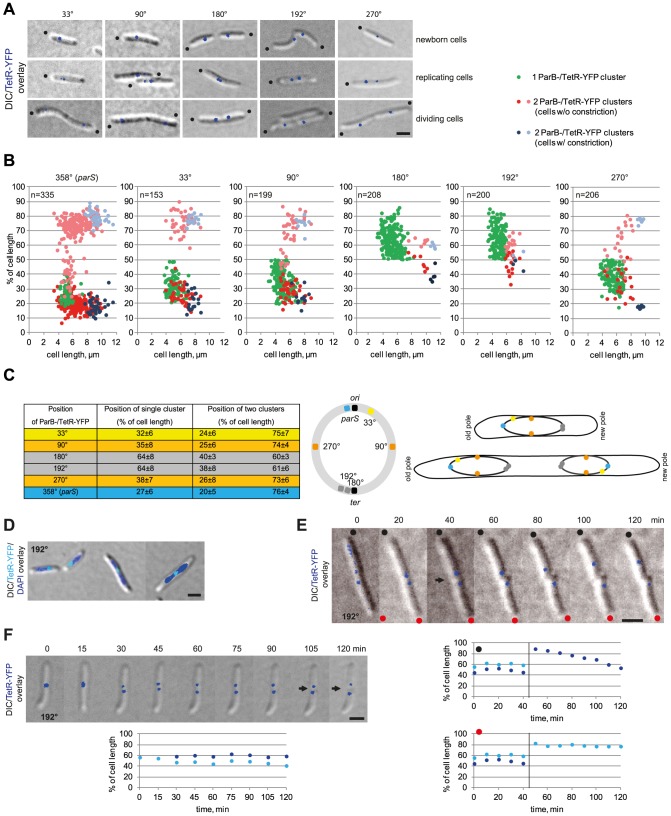
Figure 4. The M. xanthus chromosome is arranged about a longitudinal axis.
(A) The localization of five chromosomal loci in M. xanthus cells. Images of newborn, replicating and dividing cells with one or two TetR-YFP clusters in strains with tetO-arrays inserted at the indicated positions on the chromosome were taken from time-lapse movies. Old poles are indicated by black dots. Scale bar, 2 µm. (B) Localization of five chromosomal loci in M. xanthus in comparison to ParB-YFP. Diagrams depict the positions of the TetR-YFP clusters in cells with a tetO-array inserted at the indicated positions on the chromosomes as % of cell length and a function of cell length (for each n∼200) in comparison to ParB-YFP localization (n = 335). The old pole represents 0% of cell length. (C) Summary of the average positions ± standard deviation (SD) for one or two TetR-YFP clusters in cells with a tetO-array inserted at the indicated positions on the chromosome. The cartoon shows the circular chromosome with the positions of the tetO-arrays using the colour code in the left panel. The right scheme depicts ori-ter, and ori-ter-ter-ori organisation in cells before (top) and after (bottom) chromosome replication and segregation using the colour code in the left panel. (D) TetR-YFP localization in cells with the tetO-array inserted at 192°. Scale bar, 2 µm. (E) Time-lapse images of the division of a cell with the tetO-array inserted at 192°. Old poles are labeled with black and red dots. The constriction is indicated by the arrow. Scale bar, 2 µm. Diagrams below show the positions of the TetR-YFP clusters in the two daughter cells over time. The old pole is at 0% of cell length. (F) Time-lapse images during replication of ter in cells with the tetO-array inserted at 192°. Scale bar, 2 µm. Diagram depicts the positions of the TetR-YFP clusters over time. The old pole is at 0% of cell length.

