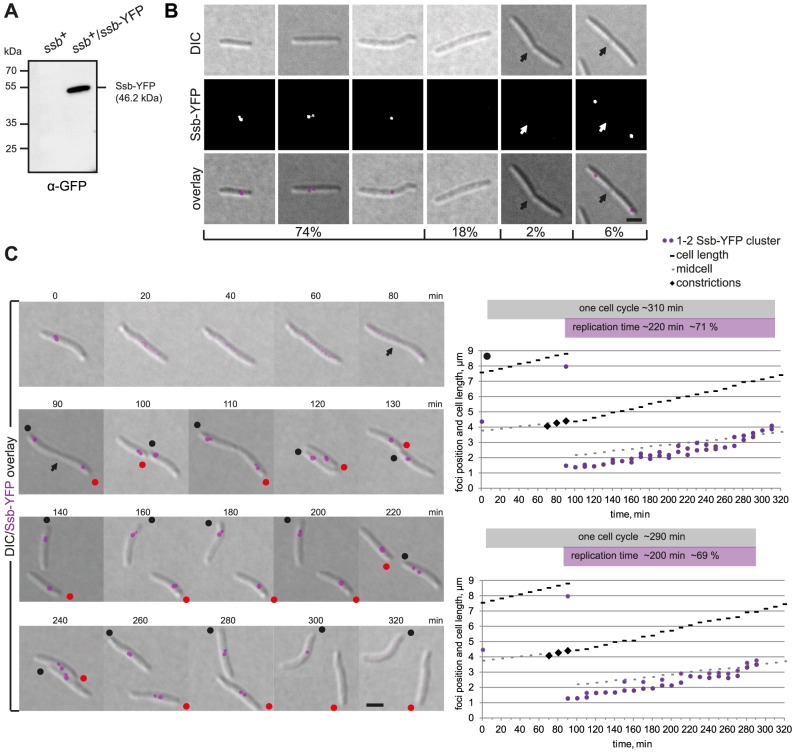
Figure 5. Ssb-YFP localization reveals two independently moving replisomes.
(A) Immunoblot analysis of Ssb-YFP accumulation in cells of the indicated genotype. Equal amounts of protein were loaded per lane and the blots probed with α-GFP antibodies. Ssb-YFP with its calculated molecular mass as well as positions of molecular markers are indicated. (B) Ssb-YFP forms distinct clusters. The left three panels show cells with one or two Ssb-YFP clusters. The next two panels show long cells and cells with a constriction in which no signal can be detected. The right panel shows a representative cell with a constriction (arrow) with two Ssb-YFP foci close to the old poles in the incipient daughter cells. Scale bar, 2 µm. (C) Time-lapse images of a dividing cell and its two daughter cells completing a full replication cycle. Notice that the cells are moving and the old poles of the two daughter cells are labeled with black and red dots. Scale bar, 2 µm. Diagrams show the positions of the Ssb-YFP clusters in the two daughter cells (black and red spot) over time. Grey boxes indicate one cell cycle based on the time intervals between the disappearance of the Ssb-YFP signals (cell marked by black dot, 10–320 min; cell marked with red dot, 10–300 min). Purple boxes indicate the time intervals in which replication occurs based on the Ssb-YFP signals (cell marked with black dot, 90–310 min; cell marked with red dot, 90–290 min).

