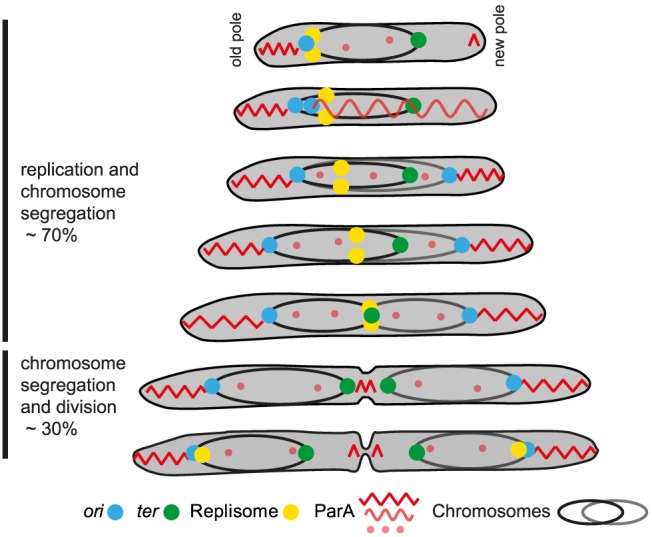
Figure 7. Chromosome arrangement and dynamics in M. xanthus.

The diagram illustrates a cell through seven stages of chromosome replication, chromosome segregation and division during a cell cycle. The two chromosomes with their associated ori (blue dot) and ter (green dot) are shown in black and grey, respectively. The replisomes are shown as yellow dots. The different forms of ParA are shown in light and dark red. See text for a detailed description.
