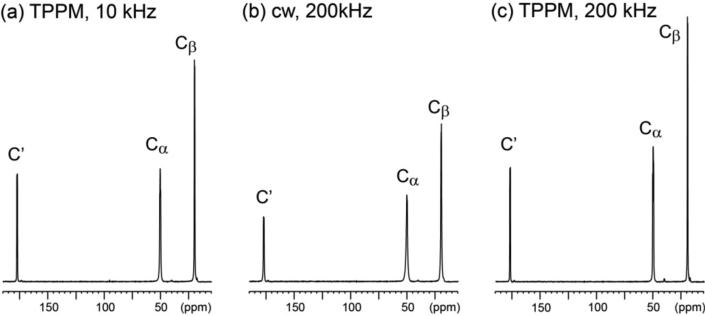
Figure 3.
13C CPMAS spectra of L-alanine obtained at the 13C NMR frequency of 100.6 MHz (9.4 T) by the (a) low-power TPPM (lpTPPM), (b) high-power cw and (c) high-power TPPM 1H decoupling sequences at the spinning speed of 40 kHz. The rf-field intensities used for the low-power and high-power decoupling sequences are 10 kHz and 200 kHz, respectively. In the lpTPPM sequence, the pulse width (τW) was 49 μs and the phase was alternated between −ϕ and ϕ (ϕ = 18.5°), while for high-power TPPM τW was 2.54 μs and ϕ = 10.5°. The pulse width and the phase angle were carefully optimized. The spectra are scaled by a common scale for comparison. The data were modified from ref. 10.

