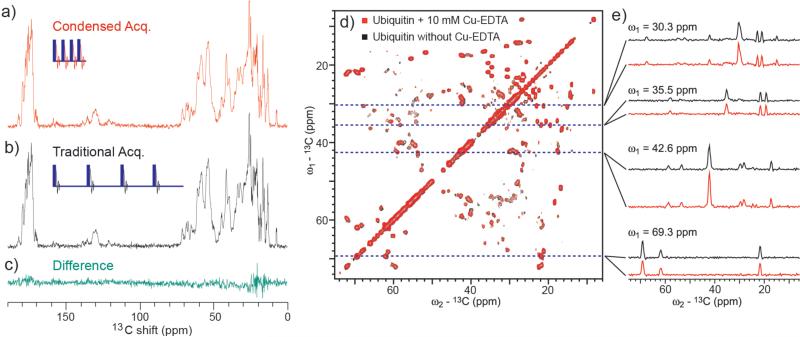
Figure 4.
Comparison of (a-c) 1D 13C CPMAS spectra and (d) superimposed 2D 13C/13C chemical-shift correlation solid-state NMR spectra of microcrystalline uniformly 13C-labeled ubiquitin in microcrystals (1.8 mg) in the (red) presence and (black) absence and of 10 mM Cu(II)-EDTA at the 1H frequency of 400.2 MHz. In (red) PACC approach and (black) traditional signal collection for (a-c), the recycle delays of 150 ms and 700 ms were set to 3 times the T1 values, respectively. The green spectrum (c) is the difference of (a) and (b). In (a, b), signals of 256 scans were accumulated with the total experimental times of (red) 0.7 min and (black) 3.1 min. (d) Comparison of superimposed 2D 13C/13C correlation SSNMR spectra of the 13C-labeled ubiquitin samples obtained in (red) PACC and (black) standard methods, together with (e) corresponding 1D slices at selected positions. The total experimental times were (red) 5.4 h and (black) 21.9 h in (d). All the experiments were performed at the spinning speed of 40 kHz with signal acquisitions under low-power TPPM decoupling at the RF fields of 7 kHz for 1.8 mg of 13C-labeled ubiquitin. The data are modified from those in ref. 11.

