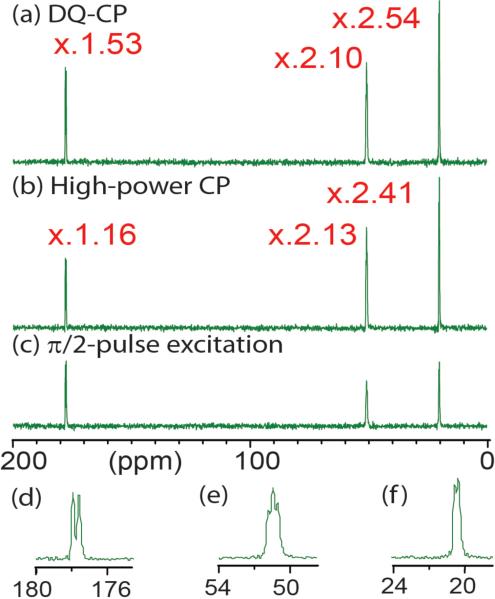
Figure 7.
(a, b) 13C CPMAS SSNMR spectra of U 13C, 15N L-alanine under super fast MAS at ωR/2π = 98 kHz. with (a) ramped DQ-CP (ωH /2π ~74 kHz, <ωC/2π> ~24 kHz) and (b) standard ramped CP (ωH/2π ~250 kHz, <ωC /2π> ~150 kHz) with a contact time of 2 ms compared to (c) a 13C MAS spectrum by π/2-pulse excitation. The signals were collected with 4 scans with recycle delays of (a, b) 3 s and (c) 120 s, where 13C T1 ~ 40 s. The factors in (a, b) denote CP efficiencies, which are the signal intensities normalized by those in (c). (d-f) Magnified spectral regions of (a) for (d) CO2−, (e) CH, and (f) CH3 groups. The data were collected with a JEOL 0.75-mm CPMAS double-resonance probe on a JEOL ECA 600 MHz spectrometer.

