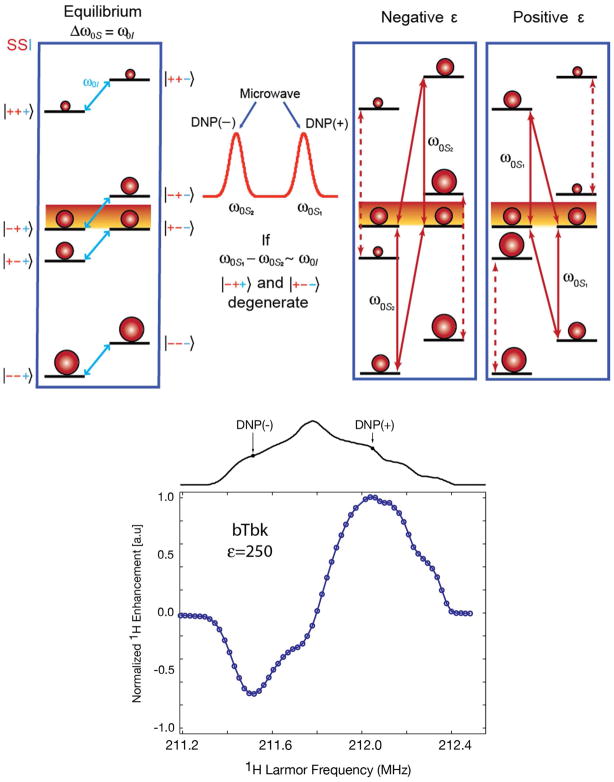
Figure 3.
(top) Energy diagram illustrating DNP via the CE. At equilibrium (left), under the matching condition, there is degeneracy and 1:1 population of the two shaded levels. The EPR spectrum of an ideal biradical for CE (middle) has two narrow lines separated by the nuclear Larmor frequency. Saturation of transitions near the first (second) EPR line gives rise to a positive (negative) DNP enhancement (right). (bottom) Field profile for bTbk with an enhancement ε= 230 14

