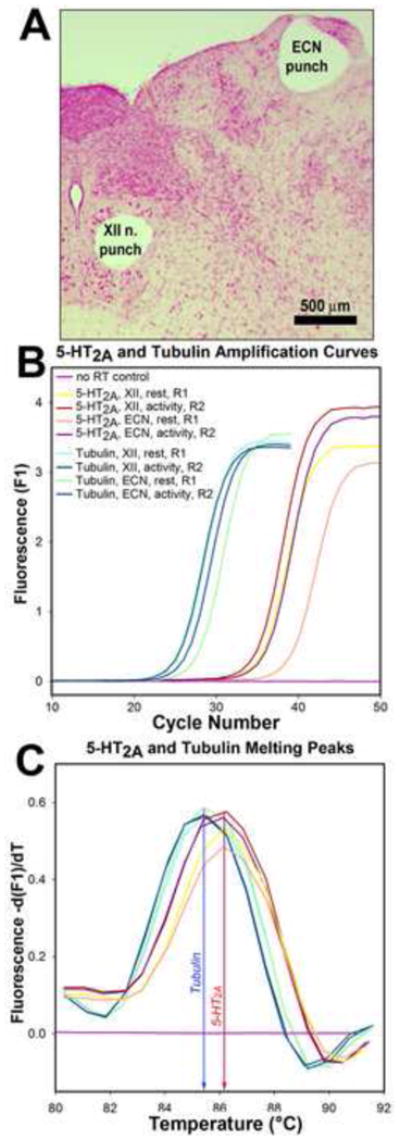
Figure 1.

Example of tissue sampling and of the outputs from RT-PCR reactions. A: location of the tissue micropunches extracted from the XII nucleus and external cuneate nucleus (ECN) visualized in a Neutral red-stained section of a medullary slice. B: PCR amplification curves obtained with a set of cDNA samples from the XII nucleus and ECN from two rats, one at the rest period onset (R1) and the other at the active period onset (R2), and from one control mRNA sample that was not reverse-transcribed. C: melting curves for the set of reactions shown in B demonstrates that the PCR reactions yielded two distinct products that had melting peaks at the temperatures expected for the 5-HT2A receptor and tubulin cDNAs.
