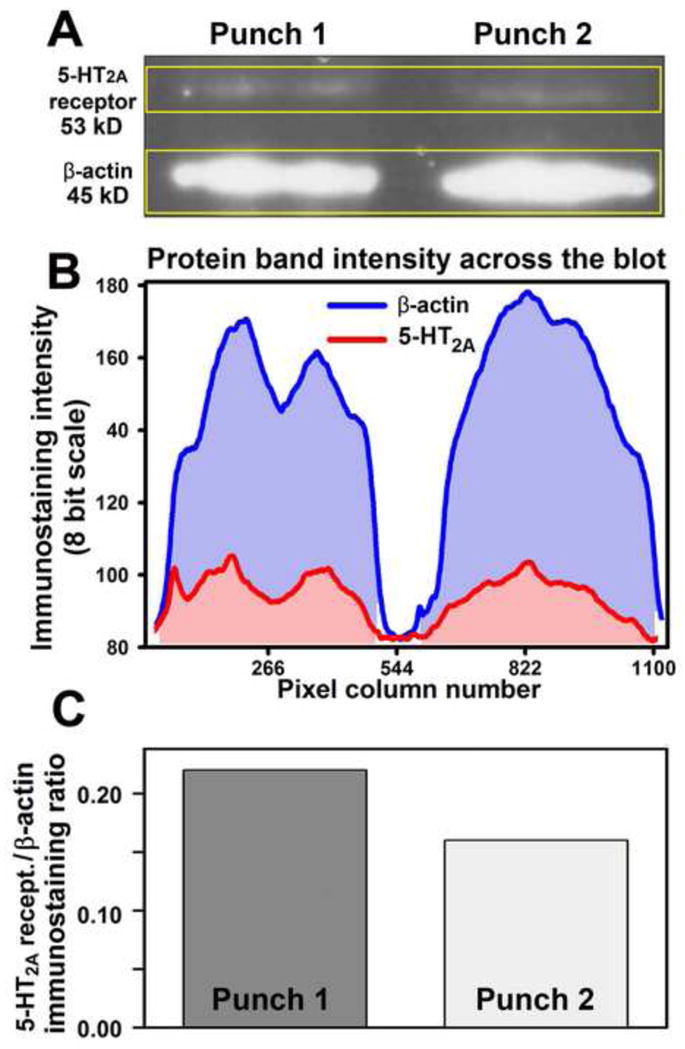
Figure 2.

Quantification of 5-HT2A receptor protein in tissue micropunches by Western blotting. A: image of a blot double-labeled for 5-HT2A receptor protein and β-actin with two protein samples (lanes) obtained from tissue micropunches. The yellow frames enclose the areas scanned for densitometric measurements of protein amounts in each band. B: staining intensity for each of the two bands measured across the gel shown in A obtained after background subtraction. C: bars representing the ratios of 5-HT2A receptor to β-actin protein amounts for the data illustrated in A and B.
