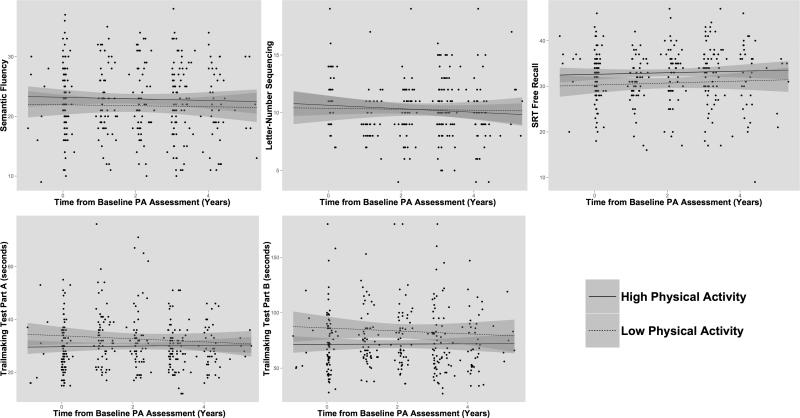
Figure 2.
Cognitive performance over follow-up assessments. Raw cognitive scores are shown for each participant from baseline through longitudinal follow-up. The trend lines represent “high” and “low” physical activity (PA) groups defined by AHA guidelines (above/below 1000 METs × minutes). No significant effects were seen for the interaction between physical activity and time from baseline physical activity assessment.

