Figure 1.
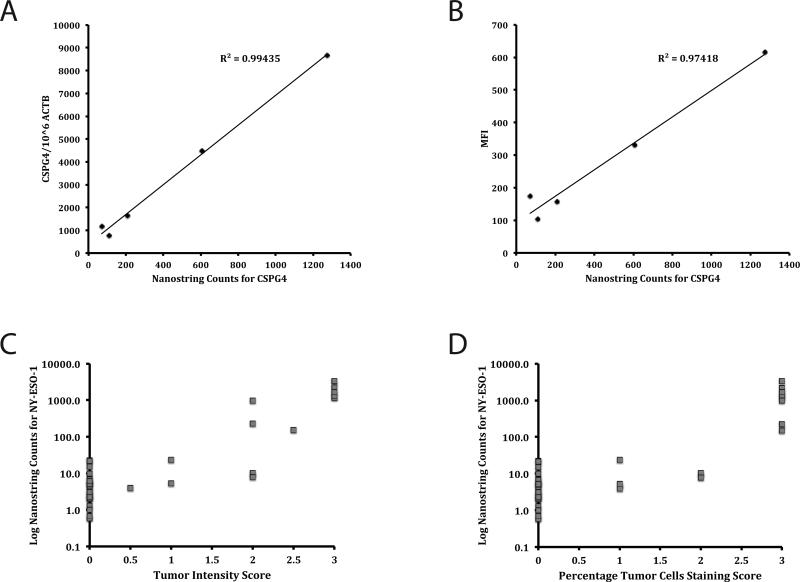
Validation of Nanostring Data. Nanostring counts for CSPG4 gene expression in five melanoma lines were graphed against results from RT-PCR analysis (A) and MFI from FACS with CSPG4-specific mAb (B). Immunohistochemistry results, including scores for intensity of staining (C) and percentage of tumors cells staining (D) for NY-ESO-1 staining in 41 tumors samples are graphed against the log of the Nanostring counts for NY-ESO-1. Immunohistochemistry scores are as follows: for intensity of staining 0=no reactivity, 1=weak reactivity, 2=moderate reactivity, 3=intense reactivity, and for percentage of tumors cells that stained 0=0%, 1=0-5%, 2=5-50%, 3=>50%.

