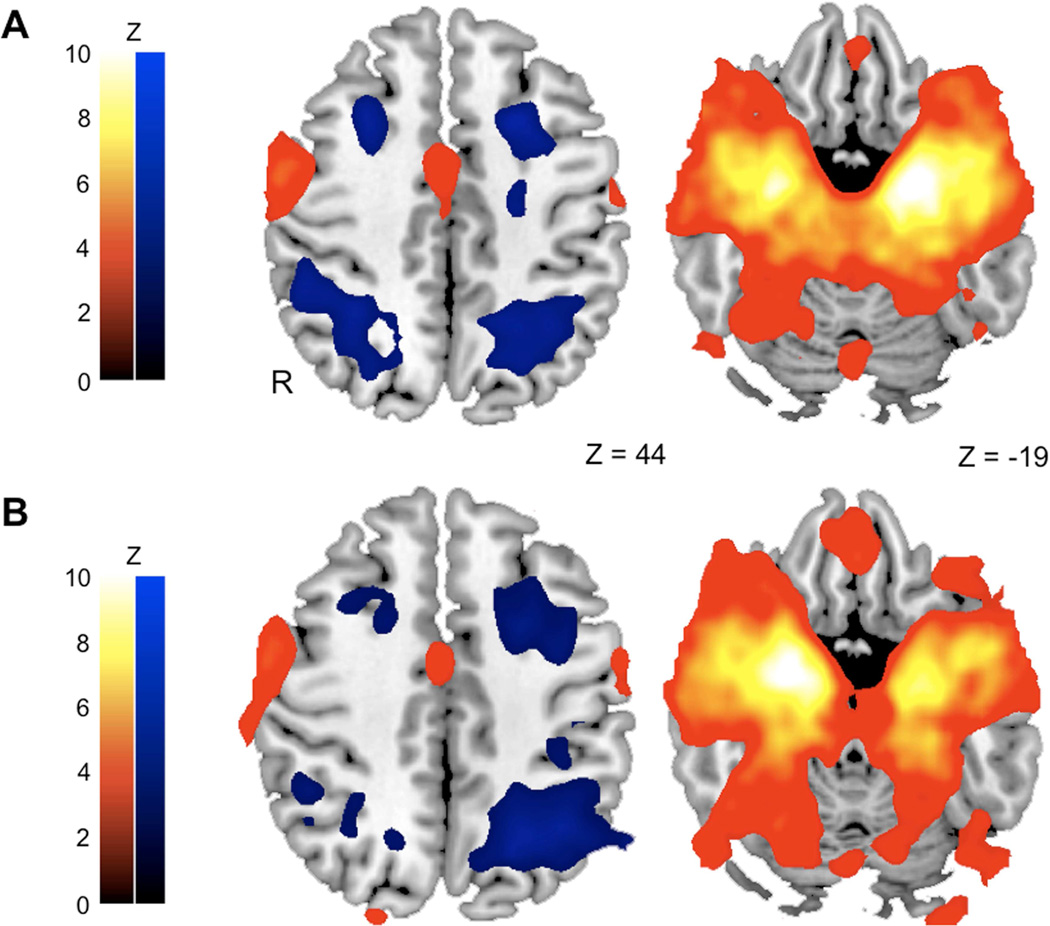
Figure 3.
Group average (A) left and (B) right amygdala resting-state functional connectivity (N =17). Patterns of activation reflect grey matter regions where dynamic perfusion signal changes were either significantly positively correlated (red) or negatively correlated (blue) with perfusion signal changes in the amygdala seed regions. The amygdala rsFC spatial maps were collapsed across stressor and control sessions and whole-brain statistical parametric maps were calculated using single-sample t-tests. Significant clusters were corrected for multiple comparisons using a cluster threshold of Z > 2.3, P = 0.05.

