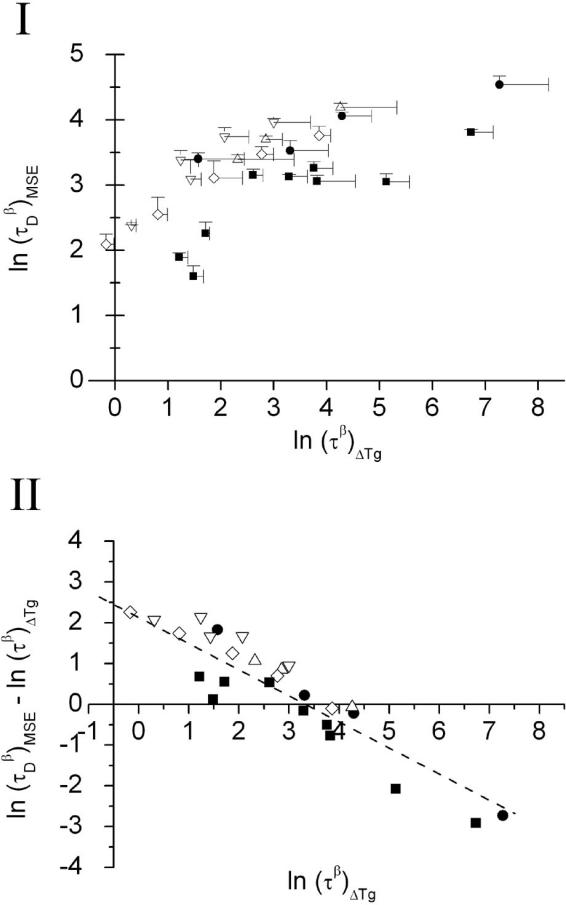
Figure 3.
(I) Comparison of relaxation data determined from the TAM method at 40 °C (using MSE fitting) with the ΔTg method for the series of freeze dried formulations. The standard deviations for both relaxation times are indicated by the error bars. (II) A plot of [(ln τDβ)MSE – (ln τβ)ΔTg] versus ln (τβ)ΔTg. The dash line is the linearly fitted line (ln y = – 0.72 · ln x + 2.4; R2 = 0.86). Symbol keys for formulations; ■ - (A) HES + disaccharide (trehalose or sucrose) at total solid of 5%; ● - (B) HES 5% + sorbitol or glycerol 0-1%; △ - (C) HES 5% + trehalose 1% + sorbitol or glycerol 0-1%; ▽ - (D) HES 5% + trehalose 3% + sorbitol or glycerol 0-1% and ◇ - (E) HES 0.75% + trehalose:glycerol.

