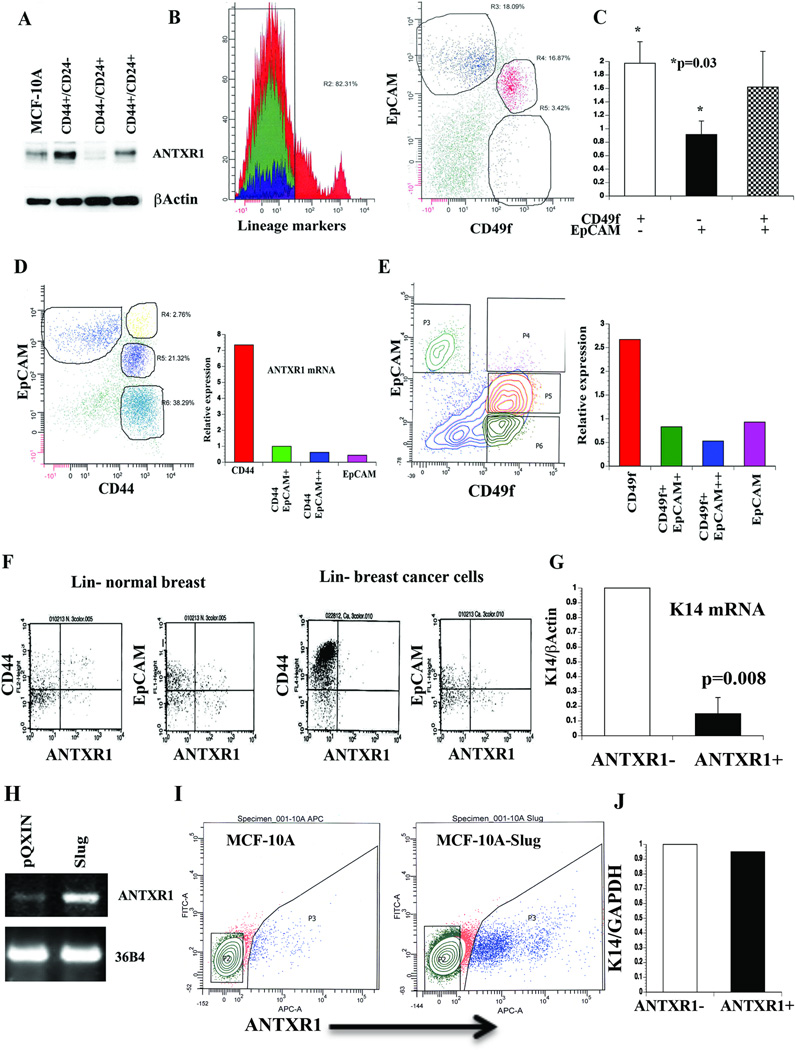
Fig. 1. Stem cell-enriched expression of ANTXR1.
A) CD44+/CD24− subpopulation of MCF-10A cells expresses higher levels of ANTXR1 compared to unsorted cells or CD44−/CD24+ cells. B) Representative FACS dotplot profile of normal breast cells stained with CD49f, EpCAM, and Lineage marker antibodies. Stem cell-enriched basal (CD49f+/EpCAM−/Lin−), luminal progenitor cell enriched (CD49f+/EpCAM+/Lin−) and mature cell (CD49f−/EpCAM+/Lin−) fractions (25, 26) were sorted for mRNA preparation. C) Stem cell-enriched basal cell fraction contains higher levels of ANTXR1 mRNA compared to mature cells (N=4, Average ± standard error, *p=0.03). D) CD44+/EpCAM− primary breast tumor cells express highest level of ANTXR1. A typical flow cytometry profile of lineage-negative cancer cells stained for CD44 and EpCAM is shown in left, and qRT-PCR results of ANTXR1 expression are shown in right. E) CD49f+/EpCAM- primary tumor cells express highest level of ANTXR1. F) Cell surface expression of ANTXR1. Lineage-negative primary normal or cancerous breast cells were stained with ANTXR1 and CD44 or EpCAM. G) Keratin 14 (K14) expression in ANTXR1-negative and ANTXR1-positive primary CD49f+/EpCAM- breast epithelial cells (n=2). H) MCF-10A cells undergoing EMT upon Slug overexpression show elevated ANTXR1. A representative RT-PCR data along with 36B4 as a control is shown. I) Cell surface ANTXR1 levels in parental MCF-10A and MCF-10A–Slug cells. J) K14 mRNA levels in ANTXR1-positive and ANTXR1-negative MCF-10A–Slug cells.

