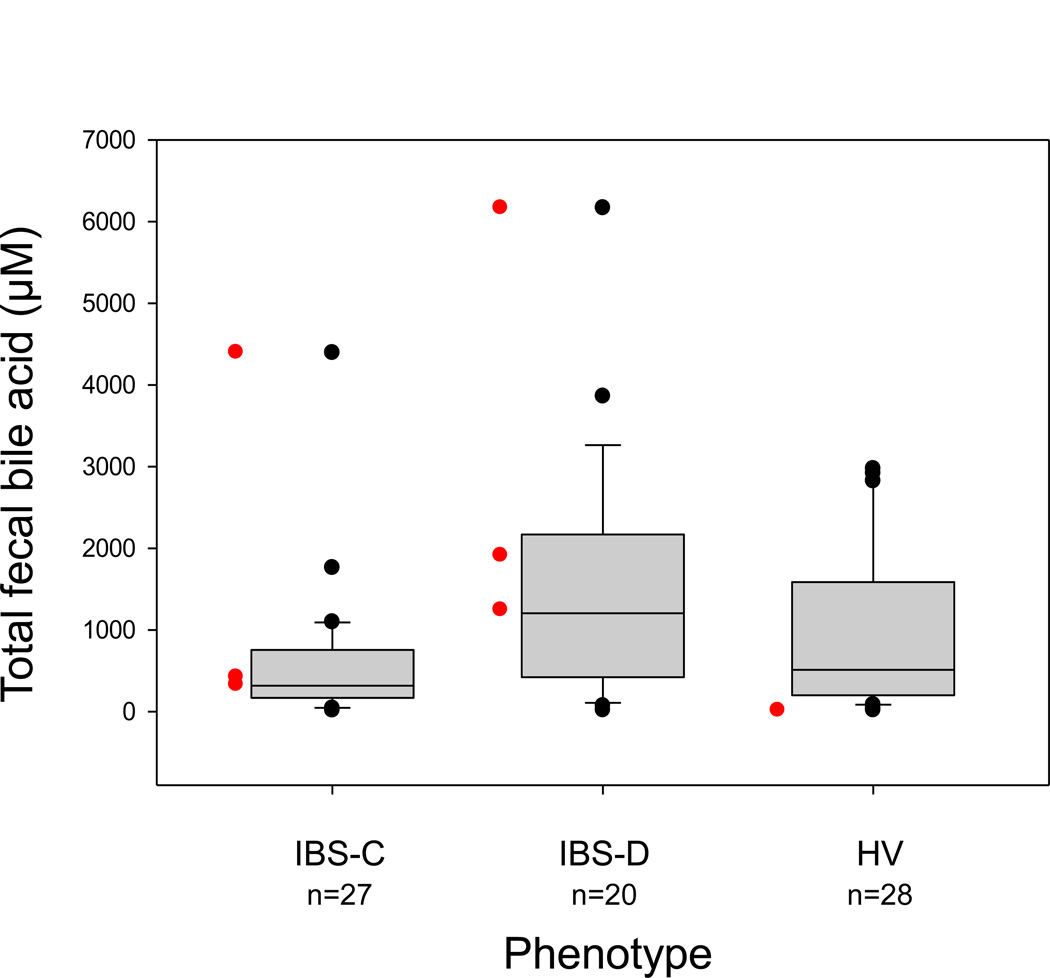
Figure 1.
Comparison of total 48-hour stool unconjugated bile acids (UBA) in the three phenotype subgroups [constipation-predominant irritable bowel syndrome (IBS-C), diarrhea-predominant irritable bowel syndrome (IBS-D), and healthy volunteers (HV)]. Data show median, interquartile range and 5–95th percentile range, as well as outliers. There was a significant three-group (overall) association between total fecal UBA and phenotype group, but no significant differences between IBS-D or IBS-C and controls. Red data points denote patients with prior cholecystectomy.

