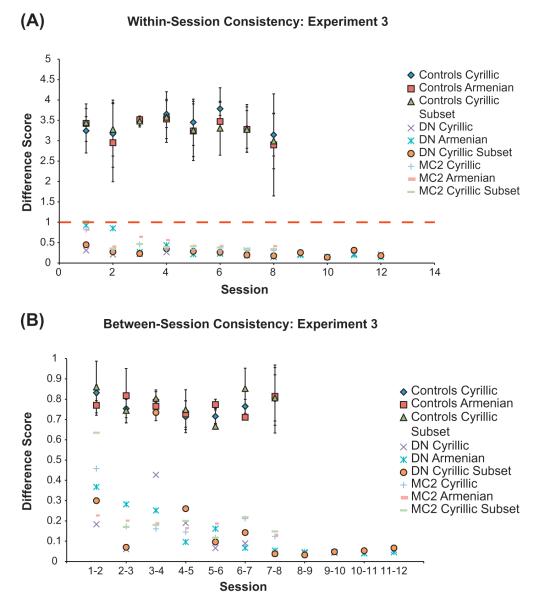
Fig. 3.
(A) Within-session consistency for Experiment 3: MC2’s and DN’s average difference scores for each grapheme set per session. Controls’ data are averaged with error bars representing the standard error of the mean. The dashed line represents the cutoff score used to identify grapheme-color synesthetes. (B) Between-session consistency for Experiment 3: Consistency in average color choices for the same grapheme between subsequent sessions for each grapheme set for MC2, DN, and the Controls’ average. Error bars represent standard error of the mean.

