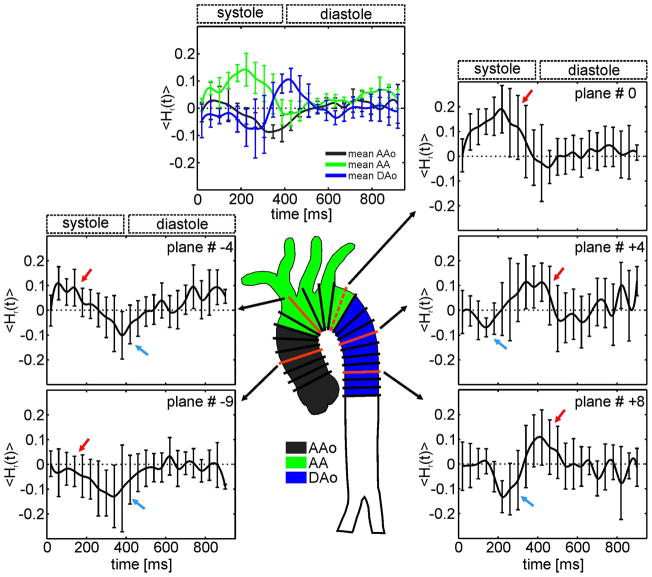
Fig. 2.
<Hr(t)> averaged over all 12 healthy subjects for 5 selected 2D planes (red) out of a maximum of 24 analysis planes distributed along the aorta. In the AAo, positive mean helicity during systole indicates clockwise rotation (red arrow), which changed to counter-clockwise rotation during early diastole (blue arrow). The AA showed only high clockwise rotation during systole but no diastolic helix flow. Further downstream in the DAo, diastolic helical flow reappeared with opposite direction of rotation compared to the AAo. The top plot shows averaged <Hr(t)> over all slices for the ascending aorta (AAo, black), the aortic arch (AA, green) and the descending aorta (DAo, blue) for healthy subjects. Standard deviations provided by the bars reflect inter-individual variations.

