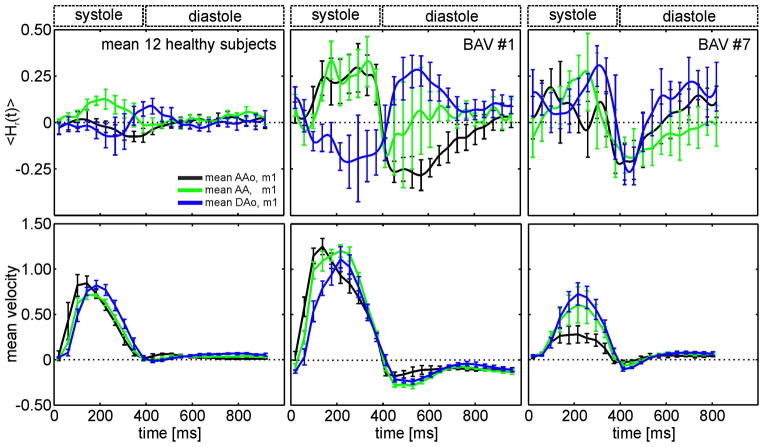
Fig. 5.
<Hr(t)> over all 2D planes in the AAo (black), the AA (green) and the DAo (blue) for the comparison of the average of 12 healthy subjects to two individual BAV patients with strong helical flow within the aorta. The corresponding velocity time curves are also illustrated. The bars indicate standard deviations. Note the increase of helicity during systole and diastole for all patients.

