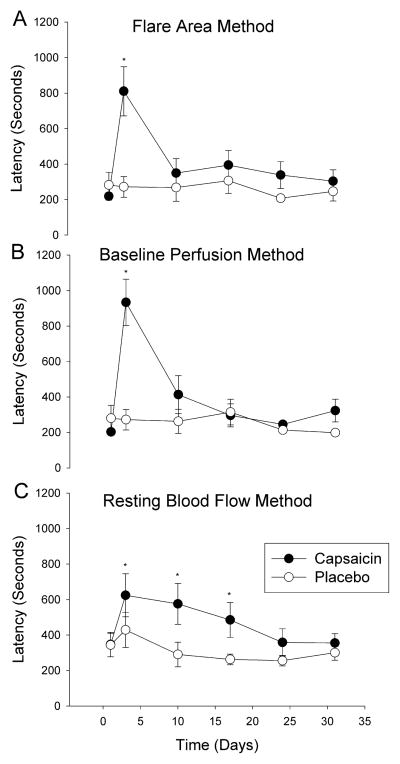
Fig. 3. Axon-reflex flare latency.
Comparison of the flare latency using the three analysis methods. Capsaicin treated skin is shown with black circles, placebo control skin is shown in white circles. In (A) the flare area method, there is an increase in flare latency on day 3 in the capsaicin treated region. In (B) the baseline perfusion method, there is an increase in flare latency on day 3 in the capsaicin treated region. In (C) the resting blood flow method, there is an increase on flare latency on days 3, 10 and 17 in the capsaicin treated region. *P<0.05. Values shown are mean ± SEM.

