Figure 3.
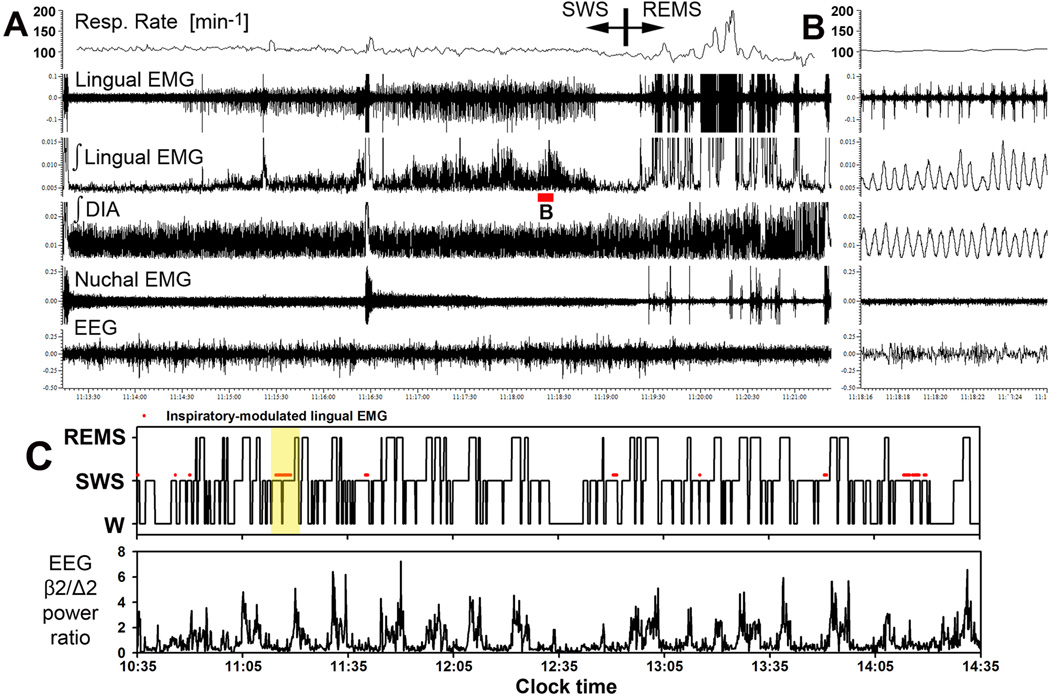
Example of a record encompassing one full sleep cycle in which prominent inspiratory modulation of lingual EMG occurred during SWS. A: compressed record spanning 12 min and 10 s, with inspiratory activity appearing in lingual EMG with a delay following the onset of SWS and then growing in amplitude (Sprague-Dawley rat 27 in Fig. 1 and Table1). The respiratory rate trace represents the mean respiratory rate in successive 3 s intervals. Respiratory modulation (RM) of lingual EMG characteristically declines and ultimately disappears during pre-REMS period. B: expanded portion of the record in A corresponding to the part of the record marked by red bar under the integrated lingual EMG trace in A. The raw lingual EMG trace shows that multiple motor units contributed to the total inspiratory activity. Lingual EMG shows considerable breath-to-breath variability, whereas integrated diaphragmatic (DIA) activity is quite regular. C: hypnogram for the first 4 h of the recording from this rat, and the associated changes in beta-2/delta-2 ratio of powers in cortical EEG. Yellow shading shows the part of the record illustrated in A. Red marks above the level in the hypnogram corresponding to SWS show when RM of lingual EMG occurred in this recording session (no RM was present in the subsequent 2 h -- not illustrated). Segments of record with RM of lingual EMG are bound to the occurrence of SWS.

