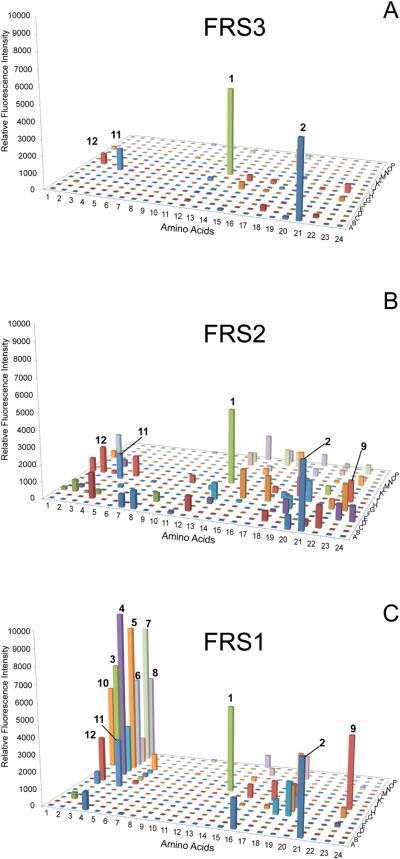
Figure 3.
Range of substrate specificity of FRS enzymes. Suppression of the sfGFP-UAG2 gene by the library of ncAA-tRNAPyl was measured by fluorescence intensity. Four wells (A1, A2, I1 and I2) were set as control experiments without adding any ncAA to detect the background signals. (A) The substrate specificity profile of FRS3. (B) The substrate specificity profile of FRS2. (C) The substrate specificity profile of FRS1 The ncAA chemical structures are given in Scheme S1 and Table S2.

