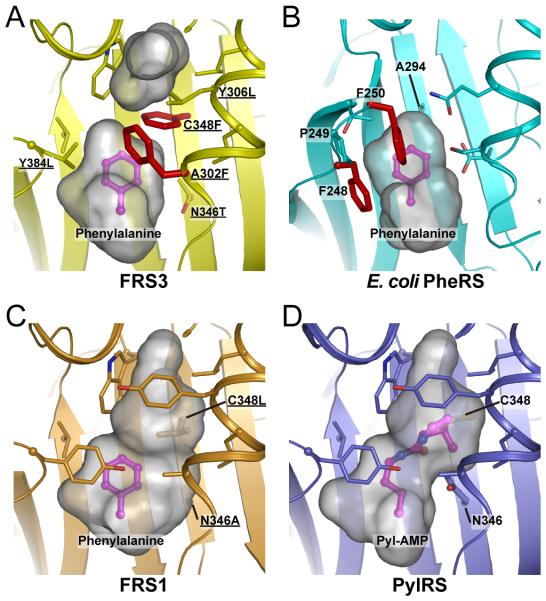
Figure 4.
The comparison of FRS3, FRS1, PylRS and E. coli PheRS structures. Structural models of FRS3 and FRS1 with Phe were generated by geometry-minimization using PHENIX [20] based on the PylRS and PylRS-derived O-methyl-tyrosyl-tRNA synthetase structures (PDB ID: 2ZIM [10] and 3QTC [12], respectively). The gray surface model indicated the volume and shape of the substrate-binding pocket; the Phe substrate (in magenta) and residues surrounding the substrate-binding pocket are shown as sticks. The residues that were chosen for the library are underlined. All figures were prepared using Pymol software (the PyMOL Molecular Graphics System, Schrödinger, LLC). (A) FRS3: Ala302Phe and Cys348Phe are located close to the substrate Phe (red sticks). (B) The co-crystal structure of E. coli PheRS with Phe (PDB ID: 3PCO [11]). Phe248 and Phe250 are conserved in bacterial PheRSs and contribute to the substrate recognition by π-interactions (red sticks). (C) FRS1: The arrangement of Ala302 and Asn346Ala can form a larger pocket for Phe analogs. (D) The co-crystal structure of PylRS with Pyl-AMP.

