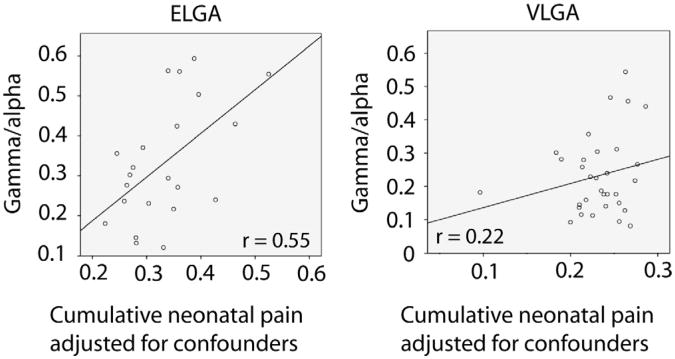
Fig. 3.
Interaction effects are illustrated by showing the regression slopes for the ELGA and VLGA groups separately. Associations between neonatal pain and spontaneous MEG oscillations for the ELGA and VLGA groups, adjusted for medical confounders (number of surgeries, cumulative morphine, illness severity, and number of days on mechanical ventilation) are displayed as the plot of the residuals computed from regression analysis.

