Figure 4.
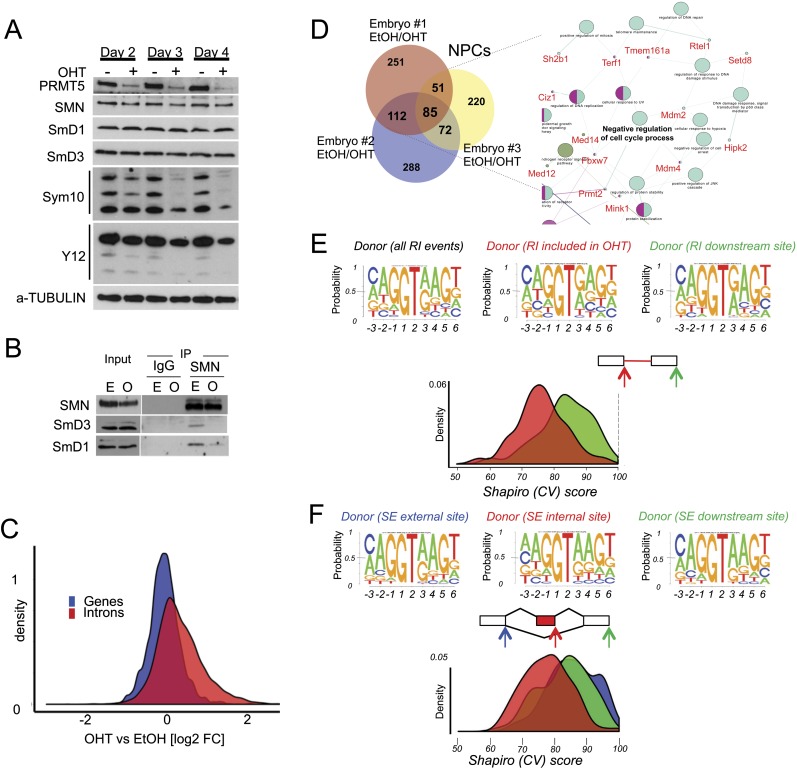
PRMT5 loss leads to malfunction of the constitutive splicing machinery and to alternative splicing events. (A) PRMT5, SmD1, SmD3, and SMN1 levels were assessed in Prmt5F/FER NPC cells depleted of PRMT5 after 2, 3, and 4 d after OHT treatment. Levels of symmetric arginine dimethylation were assessed by staining SmB/B′, SmD1, and SmD3 with SYM10 and Y12 antibodies. (B) Coimmunoprecipitation between SMN, SmD3, and SmD1, as indicated, in the presence ([E] EtOH) or absence ([O] OHT) of PRMT5. (C) Total number of reads in introns (red) or genes (blue) expressed as fold change of the events in NPCs lacking PRMT5 over control (wild-type PRMT5). A smooth density estimate is drawn as calculated by a Gaussian kernel. (D) Number of genes affected by alternative splicing events in each NPC population (derived from independent embryos). (Right panel) (Snapshot; full figure is in Supplemental Fig. S4B.) Network representation of the differentially spliced genes upon Prmt5 deletion in NPCs. The gene ontology (GO) terms are represented as nodes based on their κ scores. The edges represent the relationships between the GO terms and the shared genes. (E) Shapiro (CV) score of 5′ donor sites of the RI events in NPCs identified by MATS. A smooth density estimate is drawn as calculated by a Gaussian kernel. The top panels depict the sequence logo of the 5′ donor of all RI events (left) and the 5′ donor of the RI events detected upon PRMT5 deletion (right, indicated by the red arrow). The CV score of the downstream donor site is displayed for direct comparison. (F) Same as in E. Shapiro (CV) score of 5′ donor sites of the SE events (in red). The CV scores of the exclusion site (left, indicated by the blue arrow) and the downstream donor site (right, indicated by the green arrow) are displayed for direct comparison.

