
Fig. 2.
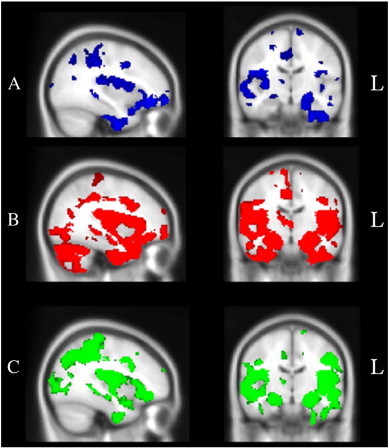
Voxel-based morphometry analyses showing brain areas of decreased grey matter intensity corrected for Family-Wise Error at p < .05 in (A) C9 mutation carriers in comparison with Controls (blue), (B) sporadic bvFTD patients in comparison with Controls (red), and (C) Alzheimer's disease patients in comparison with Controls (green). Coloured voxels show regions that were significant in the analysis using the threshold-free cluster enhancement method (tfce), and overlaid on the MNI standard brain. All clusters reported t > 2.07.