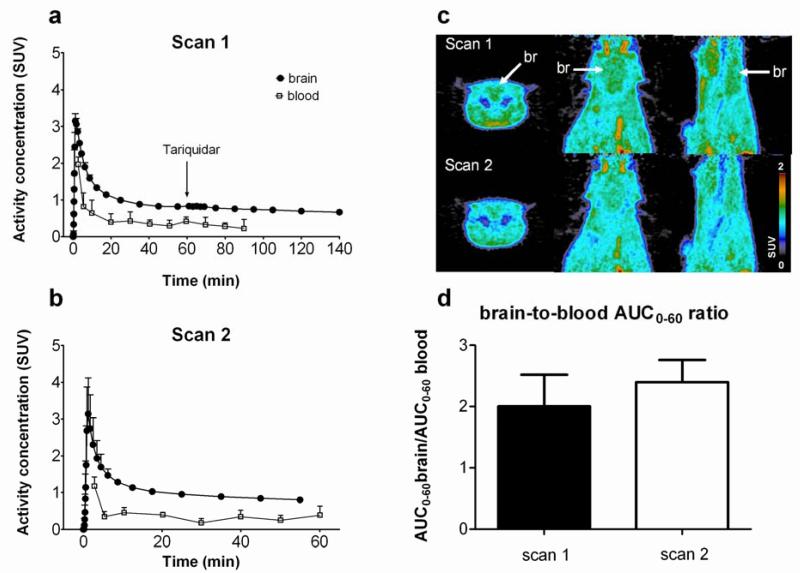
Figure 3.
In vivo evaluation of [11C]mephobarbital in rats. (a) Mean (± SD, n = 3) time-activity curves in whole brain (filled circles) and arterial blood (open squares) for scan 1 and (b) scan 2. Activity concentration is expressed as standardized uptake value (SUV). The time point of tariquidar administration during scan 1 is indicated by an arrow. The arterial blood curves are only shown for time >3 min. (c) Representative PET summation images (0-60 min) for scan 1 and scan 2 in coronal, horizontal and sagittal planes (from left to right). Radiation scale is set from 0-2 SUV. The localization of the brain (br) is indicated by white arrows. (d) Mean (± SD, n = 3) brain-to-blood AUC0-60 ratios for scan 1 and scan 2.

