
Fig. 6.
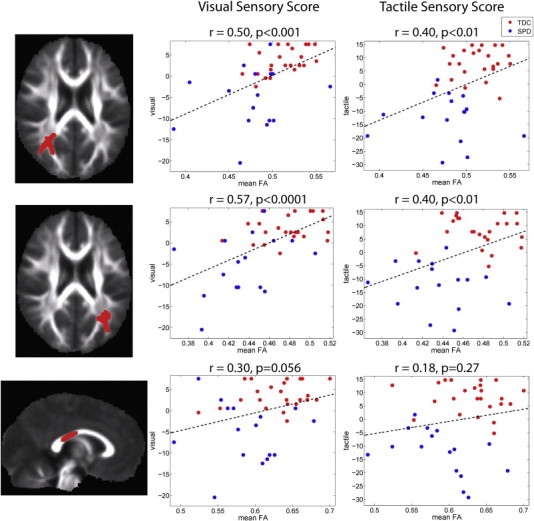
Correlation of FA with tactile and visual sensory scores: The left column displays the clusters extracted from the statistical image for the correlation (p < 0.05) and the right column displays the plot of mean FA in each cluster versus the mean-centered visual and tactile scores for the TDC (red) and SPD (blue) groups. The correlation coefficient and corresponding p-value are provided for each cluster along with the best-fit linear trend line. The three clusters, one in right PTR (top row), one in left PTR (middle row), and one in the posterior body of the corpus callosum (bottom row) are identical to those in Fig. 3.